1. Baptism by Fire: three things we have learnt from our first 9 months of trading.
2. Daring to be Different: why our unique, contrarian strategy positions us for success.
3. Meme-Stock Mania: Why we bought Kohl’s before it was cool.
We listed our flagship US Small Caps Active ETF (ASX:SVNP) in November last year. Having rode the post-COVID bull run from mid-2022 in our pre-launch paper-trade testing (where our strategy registered a 27% annualised alpha), our timely (and entirely coincidental) intersection with Trump’s second coming has delivered a barrage of market challenges that investors need no reminding of.
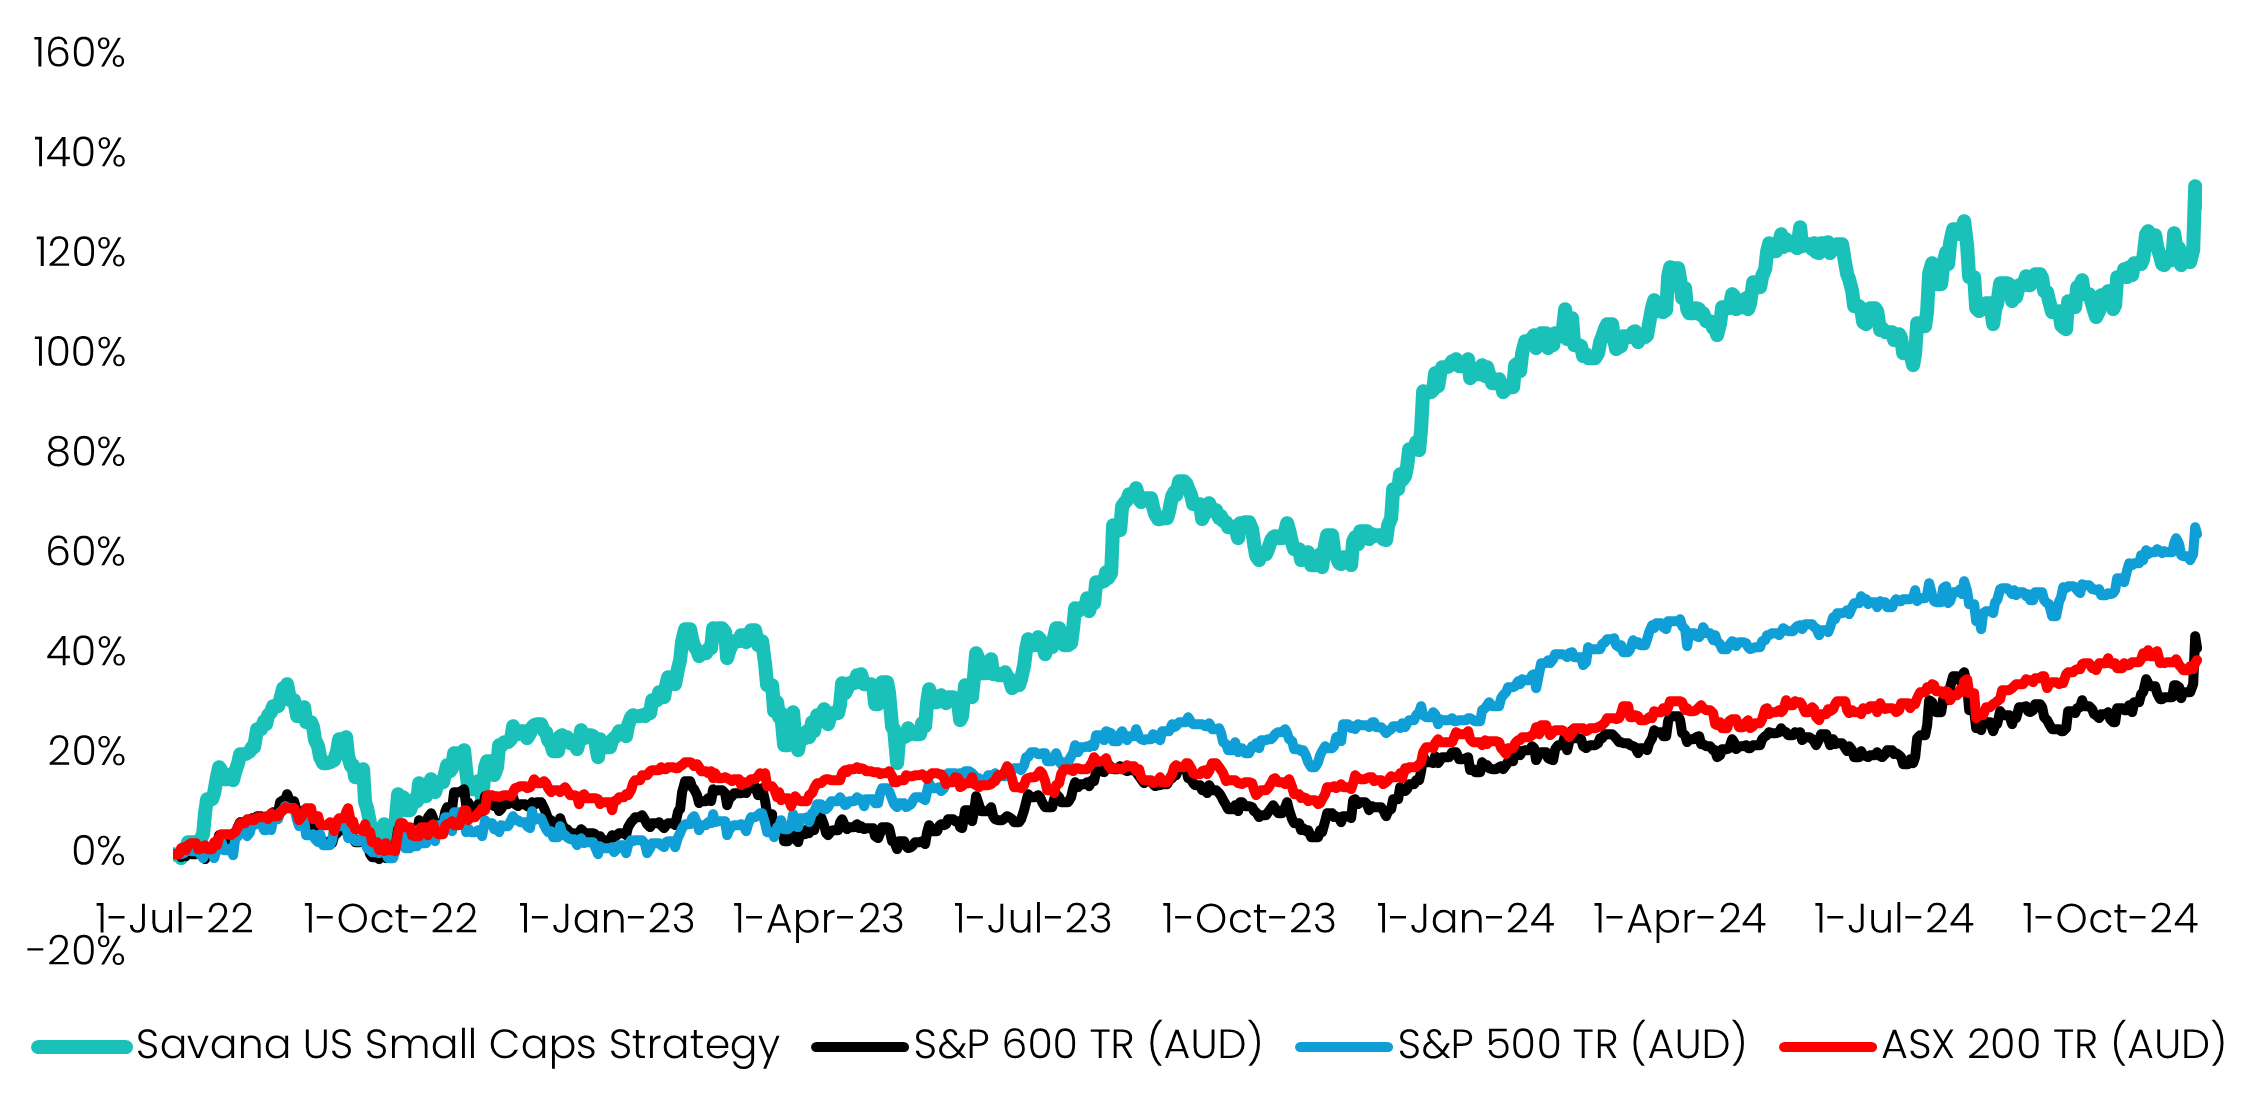
Source: Savana, S&P Global. Performance represents a contemporaneous paper-trade simulation of Savana's US Small Caps investment strategy, with no actual money invested. Performance range is from 1 July 2022 to 7 November 2024. Total returns are calculated in Australian dollars and do not include any assumptions of fees or costs. The simulation assumes that dividends are reinvested. Past performance is not indicative of future performance.
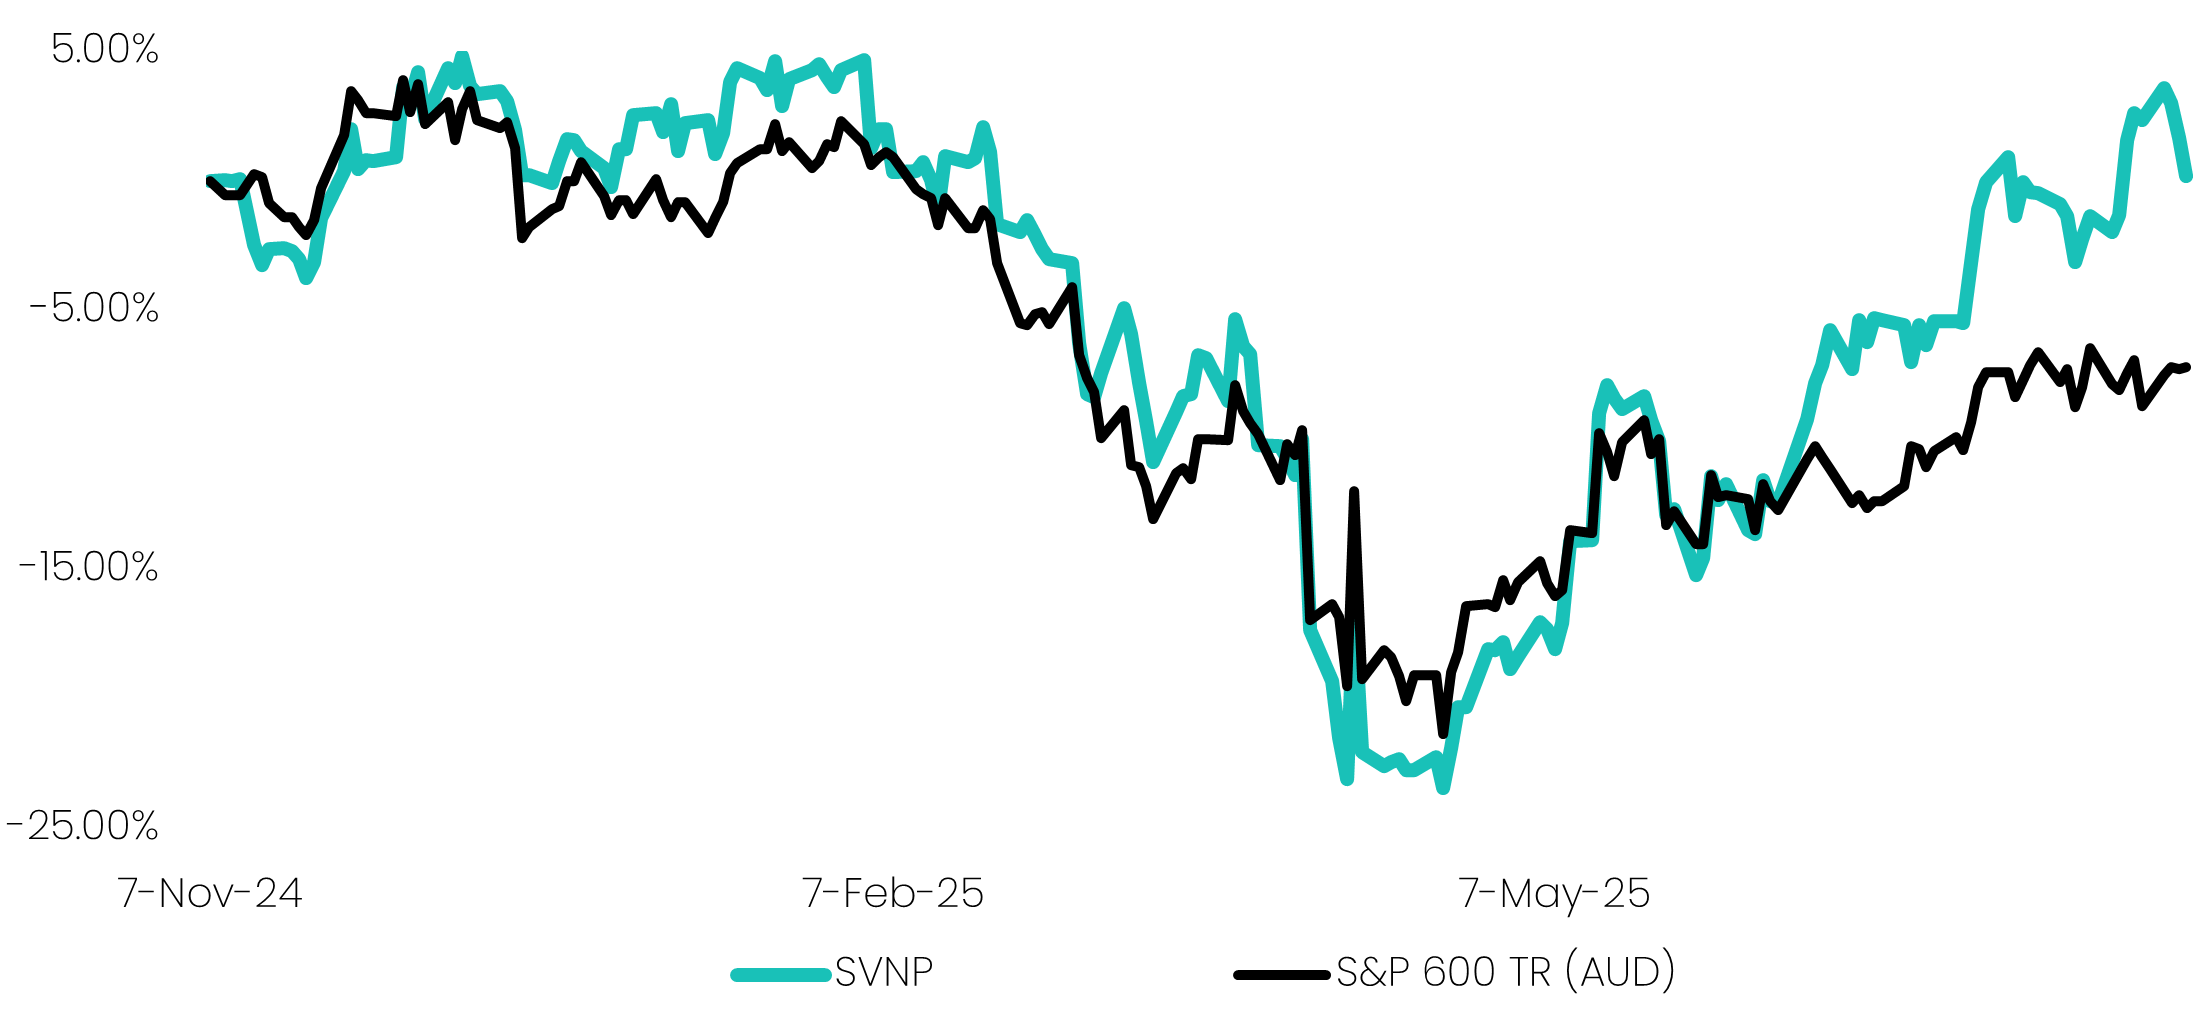
Source: Savana, S&P Global. Performance from 7-Nov-24 to 31-Jul-25. Total returns are calculated in Australian dollars based on the net asset value per unit. Returns are after fees and costs with dividends reinvested. Past performance is not indicative of future performance.
While a Goldilocks scenario might have been preferred, Savana’s ‘baptism by fire’ reality since listing has inadvertently worked to our advantage - stress-testing our algorithms in extreme conditions while further validating our core thesis: that our strategy succeeds in delivering asymmetric returns, even in the harshest conditions.
Here are the three things we have learned:
The 23% market drawdown since inception to the April nadir was followed by an equally sharp 31% V-shape recovery as of 31 July. Investors who chose to sell down or rotate assets in response to the falling market likely missed much of the subsequent rally. This approach not only crystalises losses on the way down but also incurs opportunity cost by being absent from the recovery. The net effect is diminished returns relative to investors who held their nerve and stayed invested.
Savana aims to capture significantly more upside while staunchly defending capital in downturns. During negative monthly movements, SVNP has been able to protects its downside by hugging its index - underperforming by just 0.41%. Conversely, during monthly upswings, Savana has taken significant ground, outperforming by 2.02%.

Source: Savana, S&P Global. Based on performance from 7-Nov-24 to 31-Jul-25. Based on total returns calculated in Australian dollars and based on the net asset value per unit. Returns are after fees and costs with dividends reinvested. Past performance is not indicative of future performance.
This asymmetric return profile stems from our contrarian, value-first philosophy, which systematically targets companies where pessimism is already priced in. By avoiding euphoric crowd-following and favouring fundamentally sound but overlooked businesses, Savana positions itself to limit drawdowns while leaving ample room for recovery and re-rating.
Ever heard the expression “no one can predict the future, least of all economists”? At Savana, we believe that this notion extends to stock pickers. During the market depths in April, nobody was predicting that the S&P 500 would be minting record highs come July.
Unlike many of our competitors that seek to read the macro tea leaves, we accept that information overload, hyperturbulence and shear randomness make it practically impossible to predict short-term market movements. Instead, our focus is on the long-term, where markets have consistently shown a remarkable capacity to self-correct and grow. This phenomenon isn’t a historical accident, it’s an empirical inevitability, explained by Complex Systems and Collective Intelligence science. Through decentralised, self-interested decision-making, market participants, as a collective, will always tend to redirect capital toward more efficient and productive uses. In other words, individual incentives, when scaled, tends to always drive collective growth and prosperity. This emergent order may be noisy in the short term, but it’s remarkably resilient over time. Attempting to outguess each macro twist ignores this key principle and often leads to reactive, suboptimal choices – like missing out on the V-shaped recovery after April’s drawdown.
With Donald Trump ripping up the rulebook and implanting his own “world order”, consider this a timely reminder. Stay the course!
Earlier this month, we were pleased to release our first Research Paper, “Beyond Human Limits: Reimaging Active Funds Management.” The analysis focussed on the performance of Savana’s flagship US Small Caps Strategy during its real-time paper-trading period from July 2022 to November 2024.
Beyond summarising Savana’s approach and performance, the real purpose of the paper was effectively twofold: (i) to highlight Savana’s highly differentiated approach; (ii) to prove that our difference is the key to our success; in other words, only by thinking and behaving entirely differently to our peers can we generate an enduring edge and create the opportunity for significant outperformance.
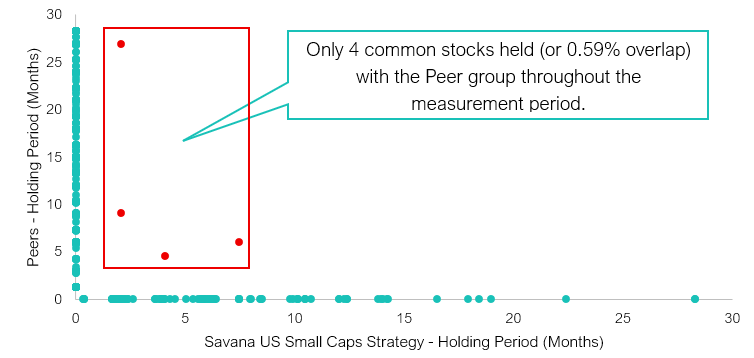
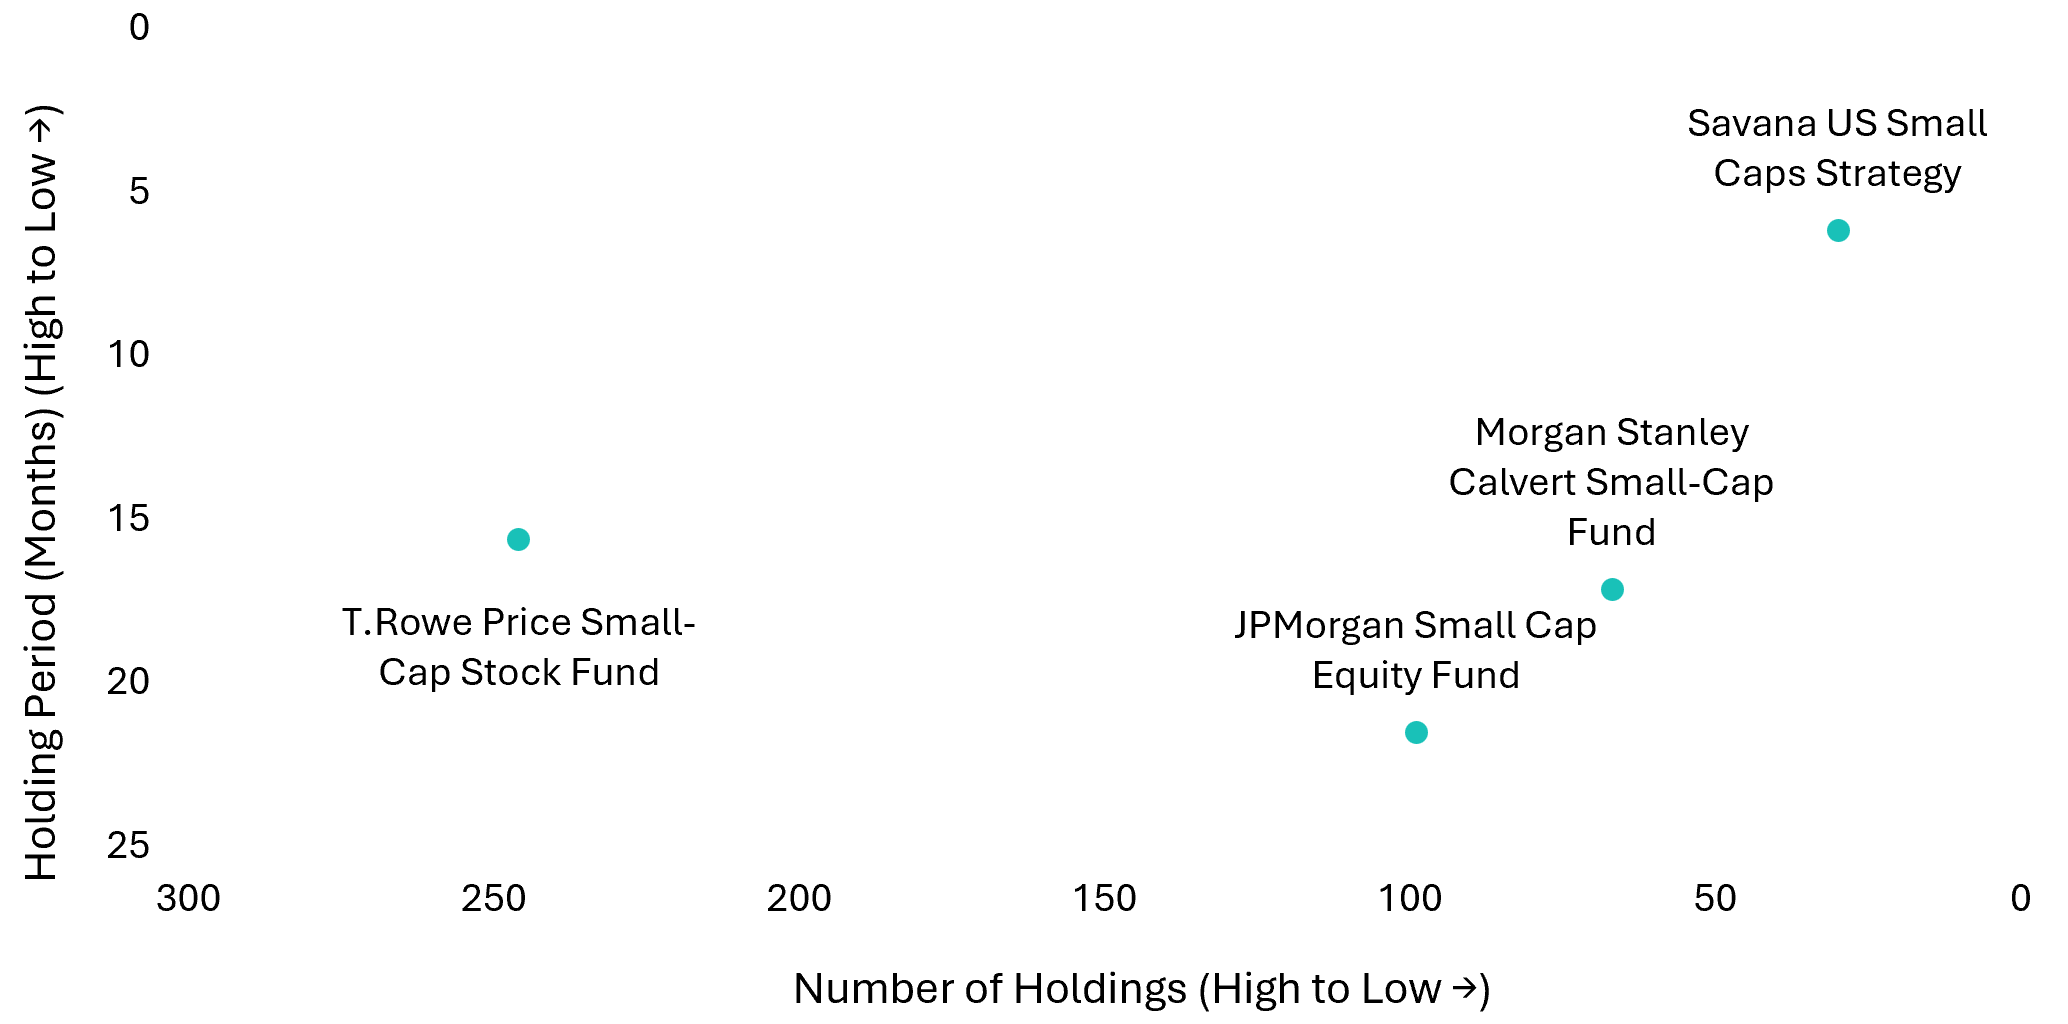
Source (Figs 1 and 2): Savana, S&P Capital IQ. Savana US Small Caps Strategy versus Peers (JPMorgan Small Cap Equity Fund (VSEI.X), Morgan Stanley Calvert Small-Cap Fund (CCVA.X), T.Rowe Price Small-Cap Stock Fund (OTCF.X)). The Savana US Small Caps Strategy was paper-traded between Jul-22 to Nov-24.
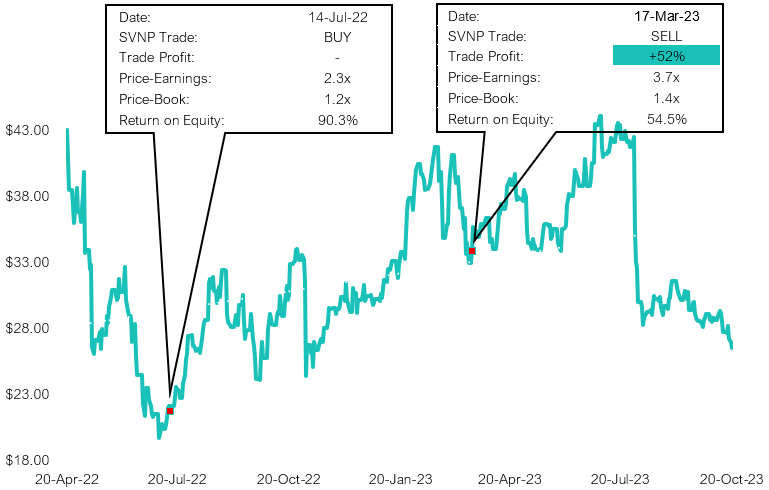
Source: Savana, S&P Capital IQ. Actual trade data from Ryerson Holding Corporation, a portfolio company of Savana’s US Small Caps Strategy, which was paper-traded from Jul-22 to Nov-24
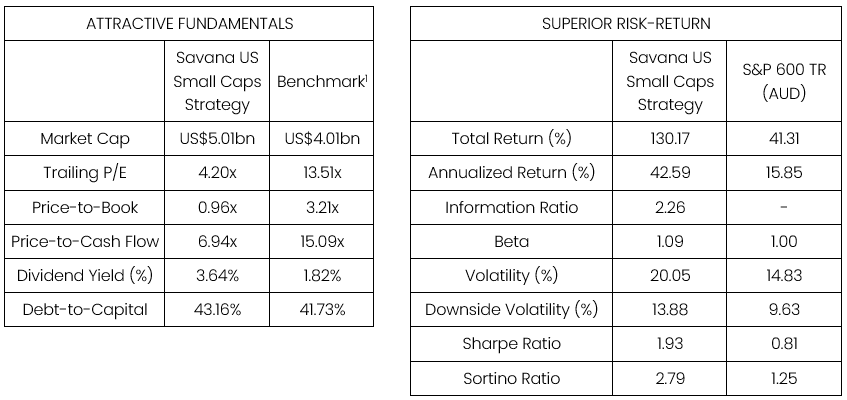
Source: Savana, S&P Capital IQ. Time-weighted average of the Savana US Small Caps paper-trade strategy from Jul-22 to Nov-24. 1 Fundamentals from the iShares Core S&P Small-Cap ETF (NYSE:IJR) is used as a proxy for the S&P 600 TR Index.
Savana’s portfolios are made distinct by what we buy, and when we buy it. Unconstrained by conventional thinking, our algorithms lead us to under-explored areas of the market where the opportunity is often greatest. Savana’s average portfolio-level fundamentals show very high value yields, including a price-to-earnings of 4.2x and price-to-cash flow of 6.9x. Sometimes, these companies represent genuine hidden gems that fly under the radar of traditional managers. Other times, these companies are perceived to be “cheap for a reason” (because they belong to legacy industries, because there was an idiosyncratic adverse event, because of perceived macroeconomic risks etc.). But as bearish sentiment gets fully priced in, the risk-reward profile shifts: downside risk becomes limited, while upside potential grows increasingly asymmetric. This delivers a dual engine for returns: the potential for a valuation re-rating and the compounding power of the companies' strong underlying cash flows.
Savana’s algorithmic strategy, uninfluenced by prevailing human sentiment, means we are uniquely positioned to capitalise on these opportunities – as demonstrated by <1% portfolio overlap with US peers (see Figure 1 above). This edge is maximised by maintaining higher conviction across fewer stocks, while amplifying our precision through shorter average holding periods (see Figure 4).
While our peers tend to deliver overdiversified portfolios that converge on the benchmark return, our highly differentiated portfolios provide the opportunity to deliver highly differentiated returns – as was observed in our Paper-Trade strategy below:
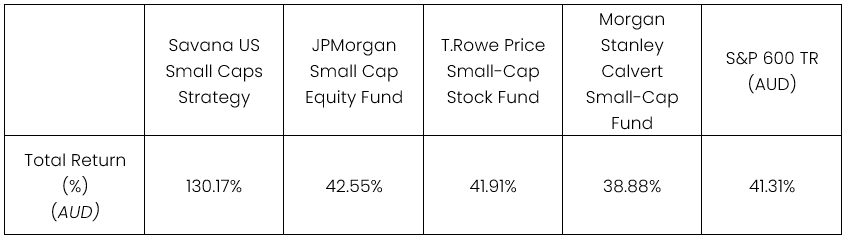
Savana US Small Caps paper-trade Strategy performance relative to peers and benchmark from 1-Jul-22 to 7-Nov-24. Past performance is not indicative of future performance.
This month saw a surprising resurgence of meme-stock mania - a throwback to the GameStop and AMC frenzy that defined the 2021 “everything rally.” This time around, Reddit-fuelled enthusiasm centred on names like Krispy Kreme, Opendoor, GoPro - and, notably, our own Kohl’s Corp. These companies are unified by hefty short floats against them, which opportunistic retail traders have attempted to exploit through coordinated buying in order to trigger short squeezes, which in turn forces rapid price surges.
Market pundits were quick to dismiss meme-stock trading as speculative indulgence, divorced from fundamentals and untethered to intrinsic value. Usually, we’d agree.
But Kohl’s Corp is the exception that few have failed to recognise.
Far from frothy, at the beginning of the month, Kohl’s traded at just 7.5x earnings, 0.25x price-to-tangible book, and a 5.9% dividend yield. Crucially, it owns the majority of its 1,153 department stores - a real estate portfolio valued at US$7.3bn on its balance sheet. That figure, however, reflects straight-line depreciation and ignores potential asset appreciation. At cost, the portfolio is worth US$14.6bn. In 2022, Kohl’s rejected multiple takeover offers, including a US$9bn bid. Today, its entire market cap sits at just US$1.2bn - despite revenue falling only 16% since.
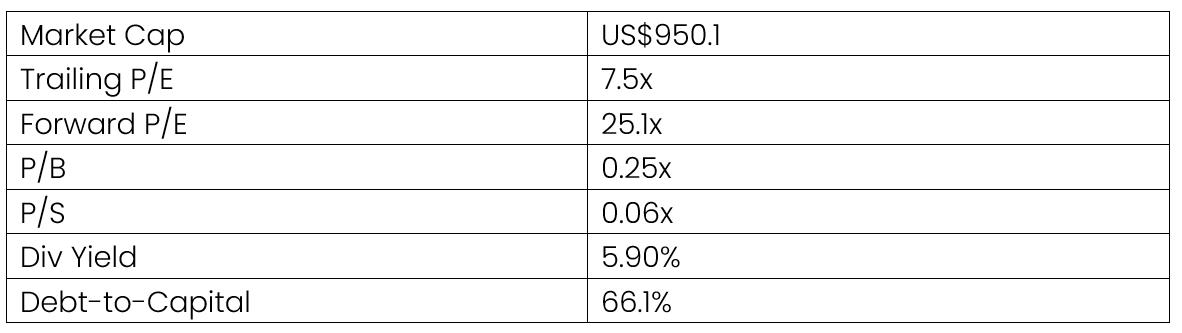
Source: Savana, S&P Global. As of 30 June 2025.
In our view, Kohl’s has long stood out as a compelling acquisition or turnaround play, even while broader market sentiment remained negative. Accordingly, we have not perceived Kohls’ recent price movement as frenzied speculation, but genuine price discovery powered by savvy retail investors pinpointing intrinsic value where Wall Street has feared to tread.
While short sellers piled in, Savana initiated its position in Kohl’s Corp in November 2024 and has held it ever since. From November to May, we endured a 64% decline in share price. Unfazed, our algorithms doubled down during bi-monthly rebalances in January, March, May, and July - lowering our weighted average entry price. When the stock price soared on the 22nd of July, Kohl’s became a profitable position in the portfolio. Since then, the price has corrected but still remains 65% higher than its April nadir.
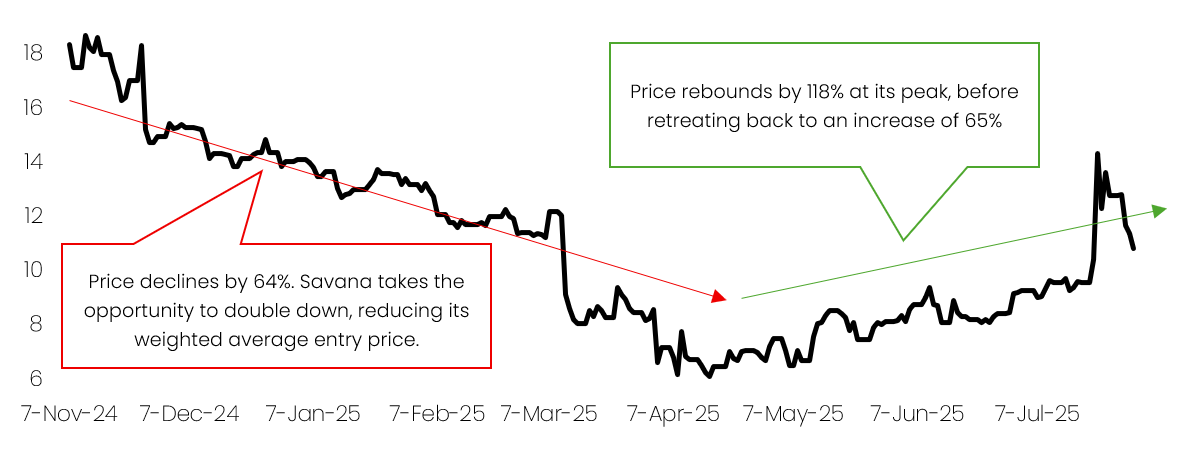
Source: Savana, S&P Global
We believe that the recent jolt delivered by retail investors - and the heightened attention that it’s triggered – will spark a reset in how Kohl’s is evaluated. Instead of reflexive short-selling on downward momentum, retail crusaders have forced institutional gatekeepers to take a harder look at fundamentals and valuation. Our hope is that this wake-up call will allow Kohl’s to trade at fairer levels going forward.
Whatever the future holds, this example perfectly demonstrates Savana’s high-conviction, contrarian thesis in action. While a company like Kohl’s is likely to be prohibitively terrifying for a human investor to go near, our disciplined algorithms are designed to seize the opportunity, ride out the volatility, and wait patiently for the upside once the market catches on.