
1. Happy Birthday SVNP: Reflections on our First Year of Performance
2. The Art of the Sell: The Payoffs - and Trade-Offs - of Strict Exit Discipline
3. The AI Reality Check: What Our LLM Stress Test Reveals About Reliability, Bias and Real-World Use
During November, Savana celebrated the one-year anniversary of its inaugural listed ETF, the Savana US Small Caps Active ETF (ASX:SVNP).
Despite a turbulent period in US markets, we’re pleased to report that SVNP has delivered 13.62% p.a. since inception, representing 13.61% p.a. outperformance versus the benchmark. In a year where small caps broadly struggled, this result is both validating and encouraging.
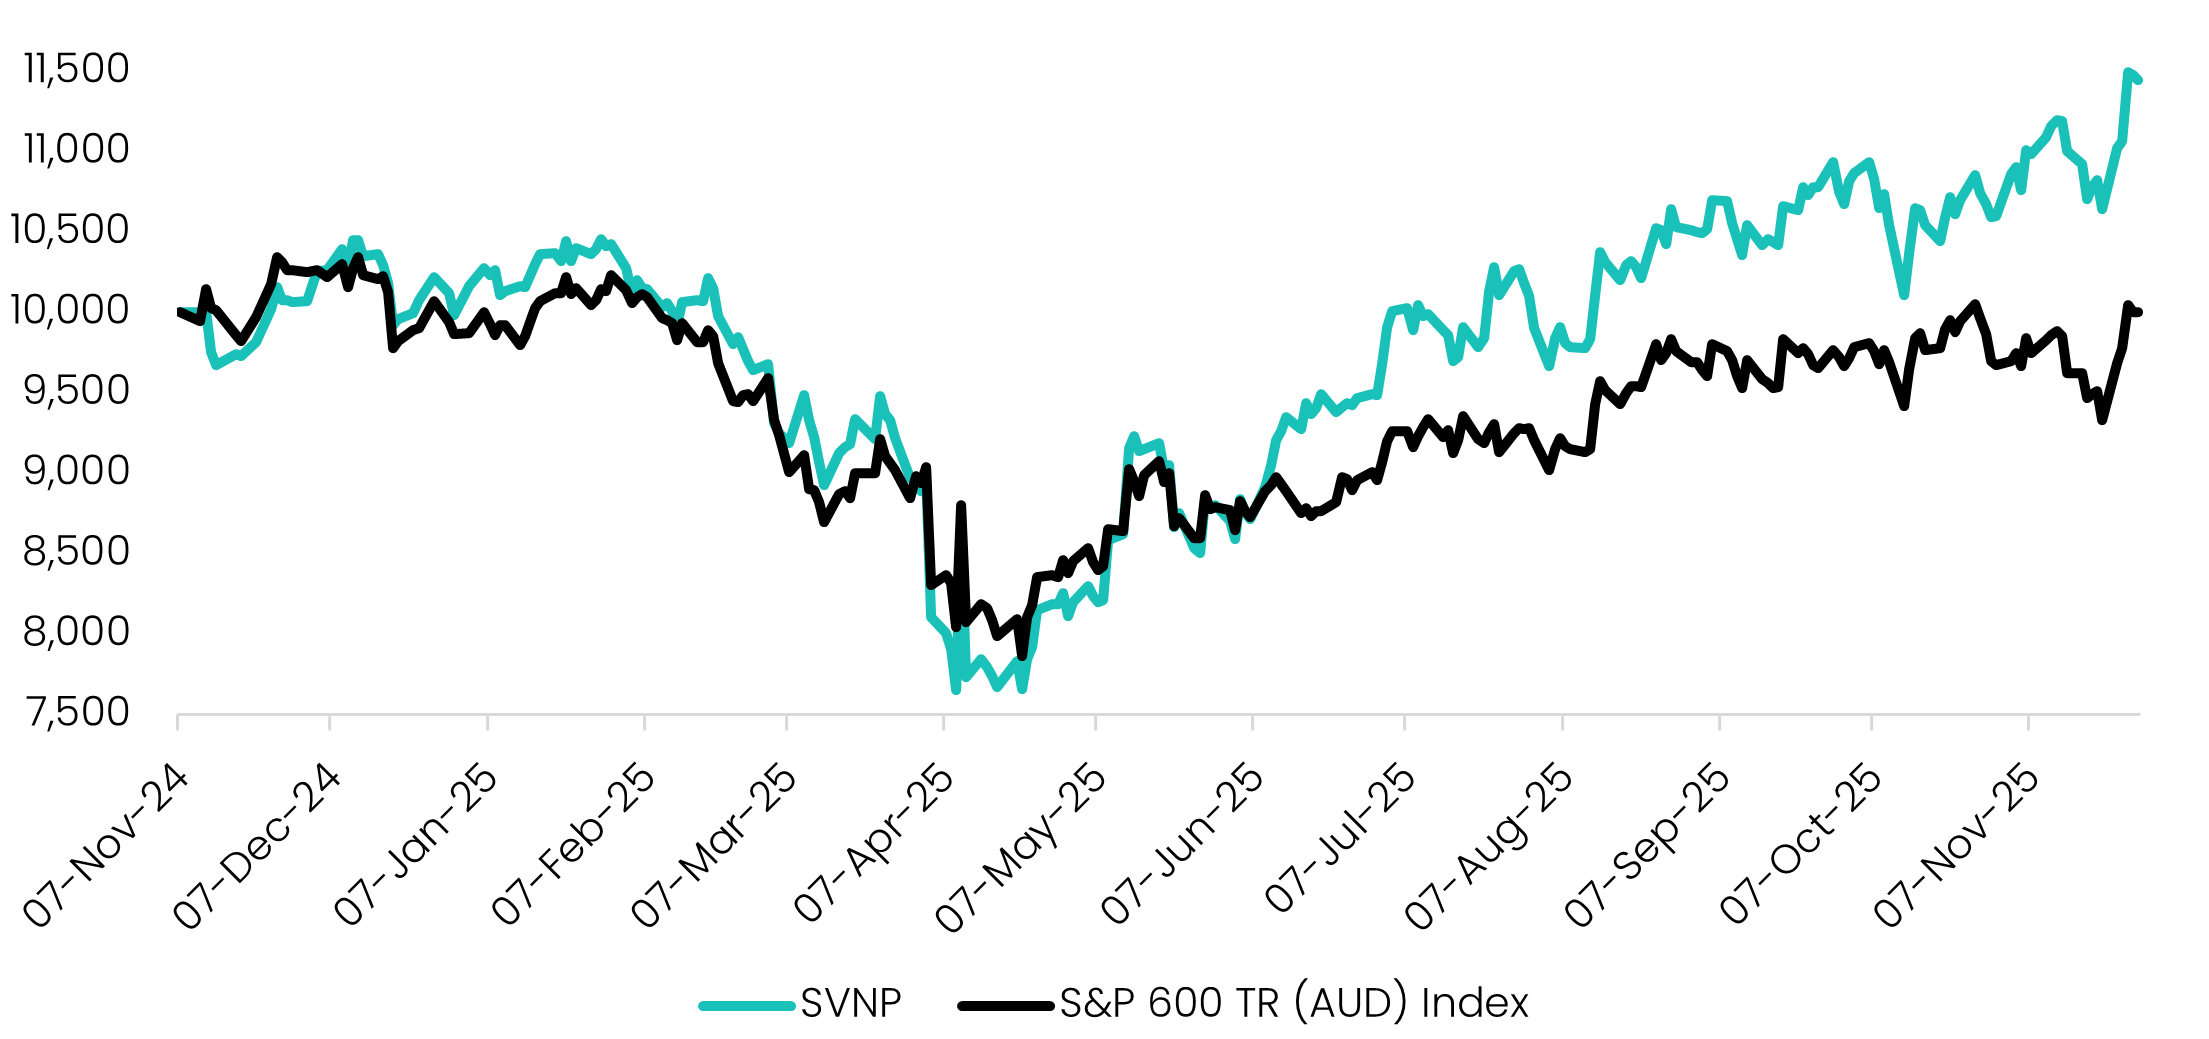
Source: Savana, S&P Global. Total returns are calculated in Australian dollars based on the close-of-day net asset value per unit. Returns are after fees and costs with dividends reinvested. Past performance is not a reliable indicator of future performance.
Importantly, the key attributes we observed during paper-trading continue to be validated in live performance: mitigated downside, strong upside capture, and the ability to deliver genuinely differentiated, excess returns. These dynamics are clearly visible in SVNP’s total returns chart.
Through April–May, the portfolio navigated a sharp ~20% market drawdown triggered by heightened concerns over proposed US tariff policies. While the timing of such a broad sell-off so soon after listing was in some ways unfortunate, it has ultimately provided an invaluable stress test – reinforcing the resilience of our algorithms under the harshest conditions, and demonstrating its ability to capture significant upside on the rebound. This is reflected in our capture ratios: on average, in months where the market has gone up, SVNP has outperformed by 1.99%, while in months where the market has gone down, SVNP has outperformed narrowly by 0.09%.
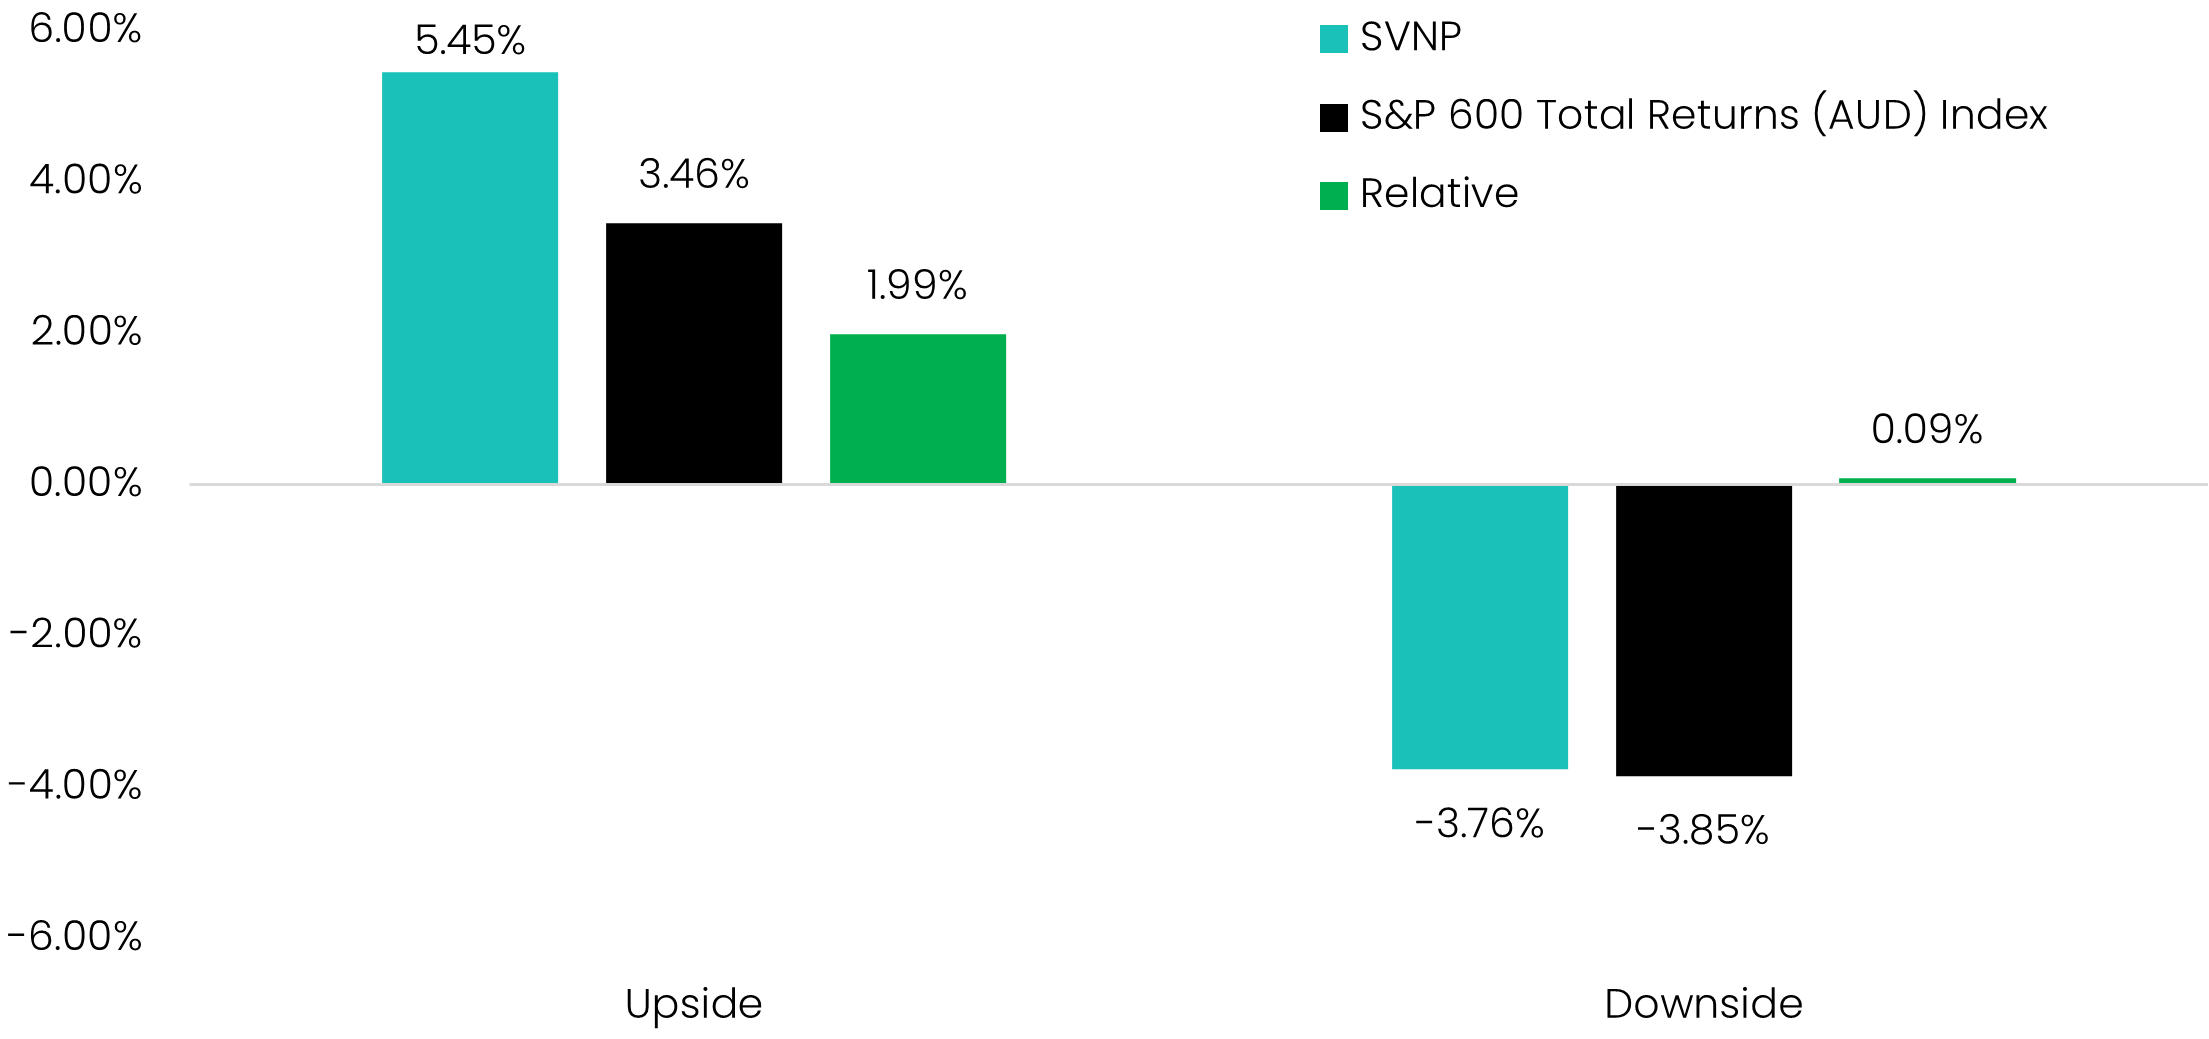
Source: Savana, S&P Global. The chart displays the average monthly return for SVNP and the index since inception during months when the index increases (“Upside”) and decreases (“Downside”). Returns are after fees and costs with dividends reinvested. Past performance is not a reliable indicator of future performance.
Looking forward, despite continued uncertainty in the US market, we believe SVNP presents a compelling case under both Bull and Bear scenarios. If conditions improve and market breadth widens, SVNP stands to benefit from strong upside capture and a potential rotation into US small-to-mid caps. Conversely, if economic data and sentiment continue to weigh on returns, the need for high-performing, genuinely active management becomes even more important.
In our view, remaining invested and exposed to the US market – where returns have historically been higher and where innovation and productivity continues to be world-leading – is an imperative for any investor. We see SVNP as a valuable complement to traditional core portfolios: diversifying US exposure away from the increasingly top-heavy S&P 500, while providing access to a differentiated, idiosyncratic return stream.
With a solid foundation established, we are incredibly excited to see what the second year of SVNP brings!
Last newsletter, we spoke about the exceptional two-month performance of Canadian Solar (NASDAQ: CSIQ). We initiated our position on 8 September at $11.50 per share, and exited 63 days later for a ~180% gain. Since our exit, the share price has retraced, falling ~16% to $27.15.
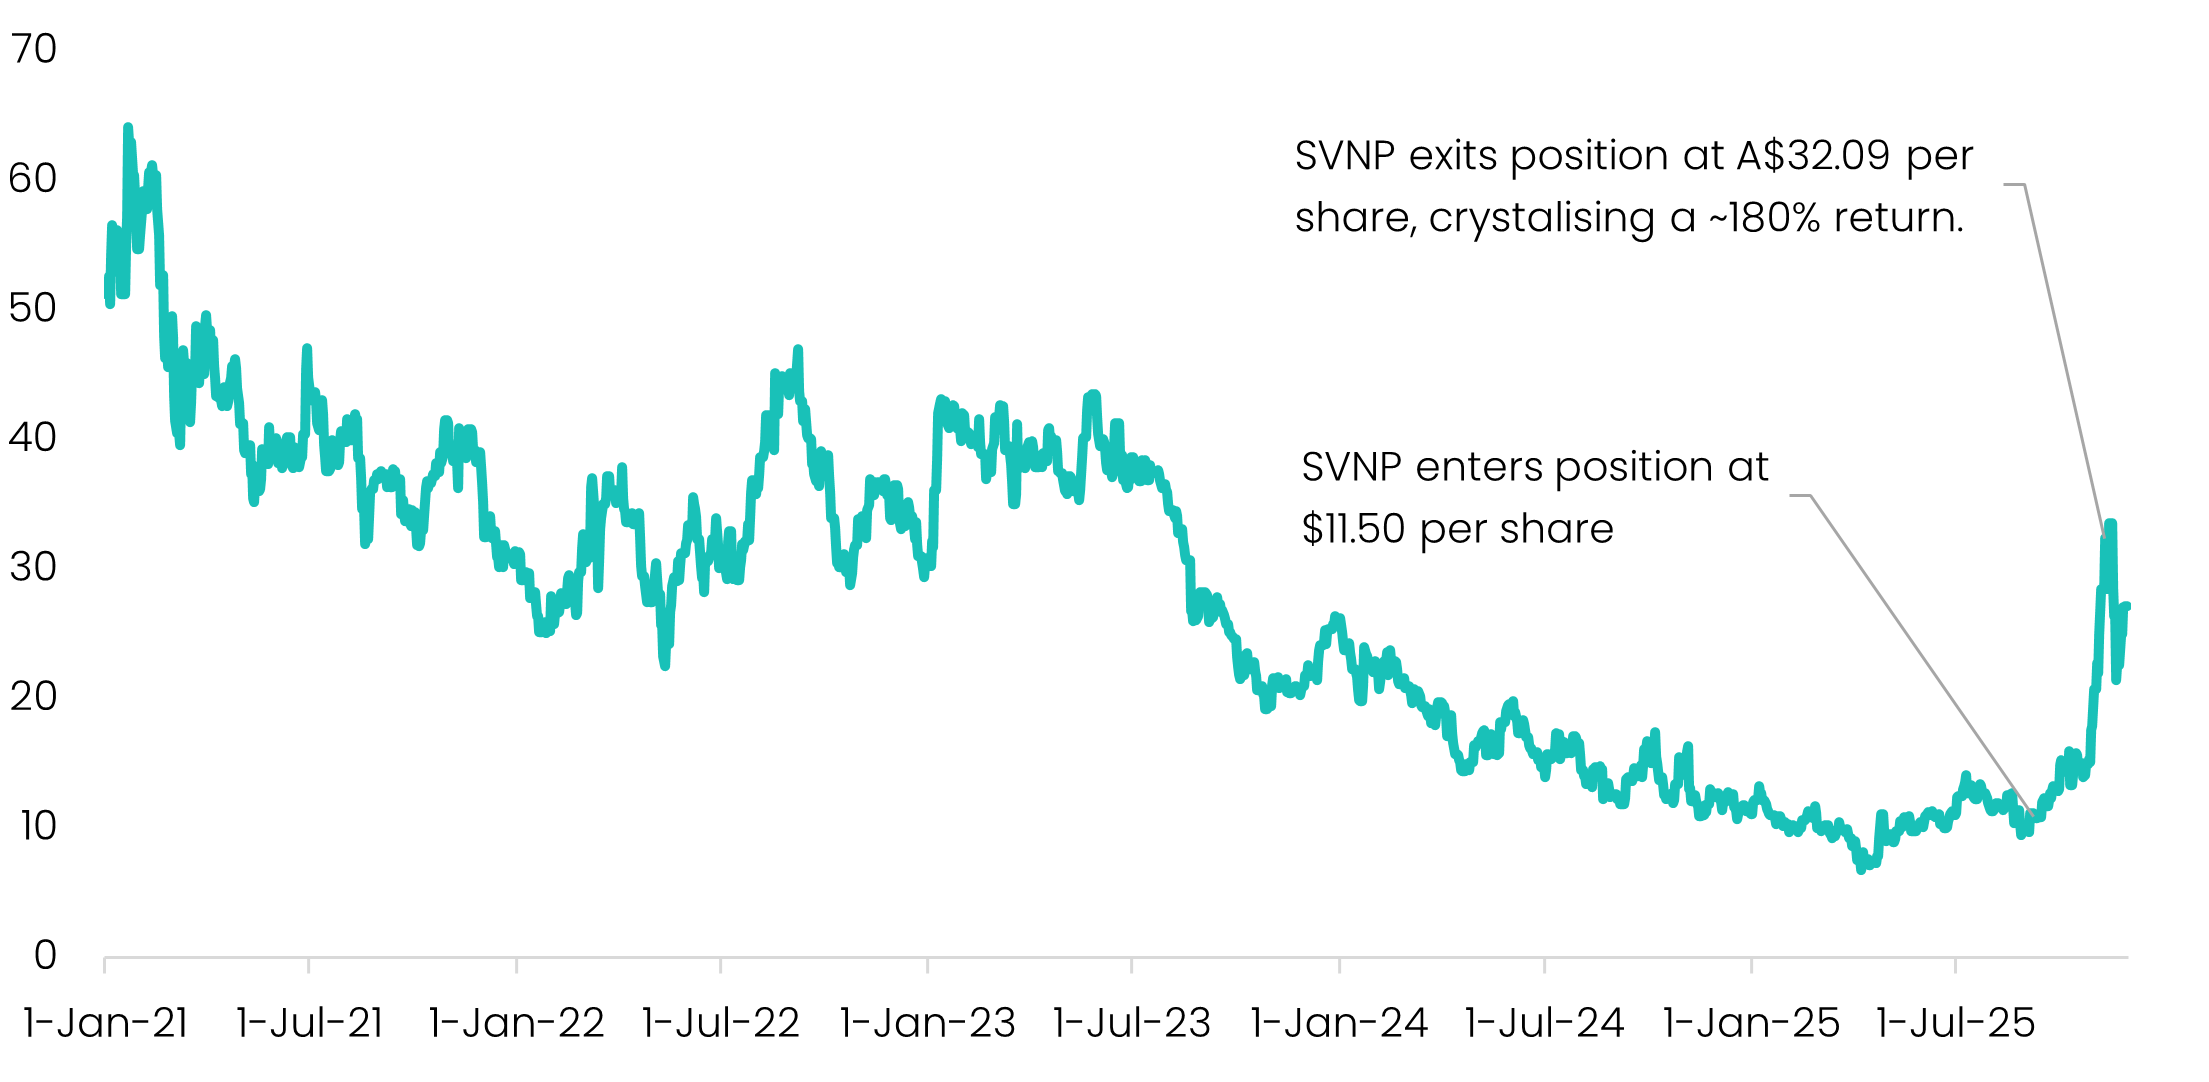
Source: Savana, S&P Global.
CSIQ is a ‘perfect’ example of our disciplined, algorithmic strategy in action. Our models identified an opportunity in CSIQ after a five-year price slide - precisely the kind of “falling knife” situation that many investors avoid. And after a 180% rebound, when many would chase the momentum further, our signals told us the opportunity had played out. So we sold.
But it doesn’t always land this perfectly. So, to keep thing real, we also wanted to share a few cases where our disciplined selling strategy didn’t go quite to plan…
Digital infrastructure provider Nebius was SVNP’s first major winner. After quietly resuming Nasdaq trading in October 2024 (following a ~2.5-year suspension), SVNP initiated a position in November at $20.09 per share and exited just two months later at $32.37, realising a 61% gain. By March, the stock had slipped back to around $20, which appeared to validate our decision to sell.
Since then, however, the share price has demonstrated that validation can sometimes be short-lived. Nebius now trades around $94, after reaching $135 in October. Ouch. The resurgence has been supported by a handful of developments - most notably surging demand for the company’s AI-infrastructure offering and accelerating revenue growth - contributing to a substantial re-rating.
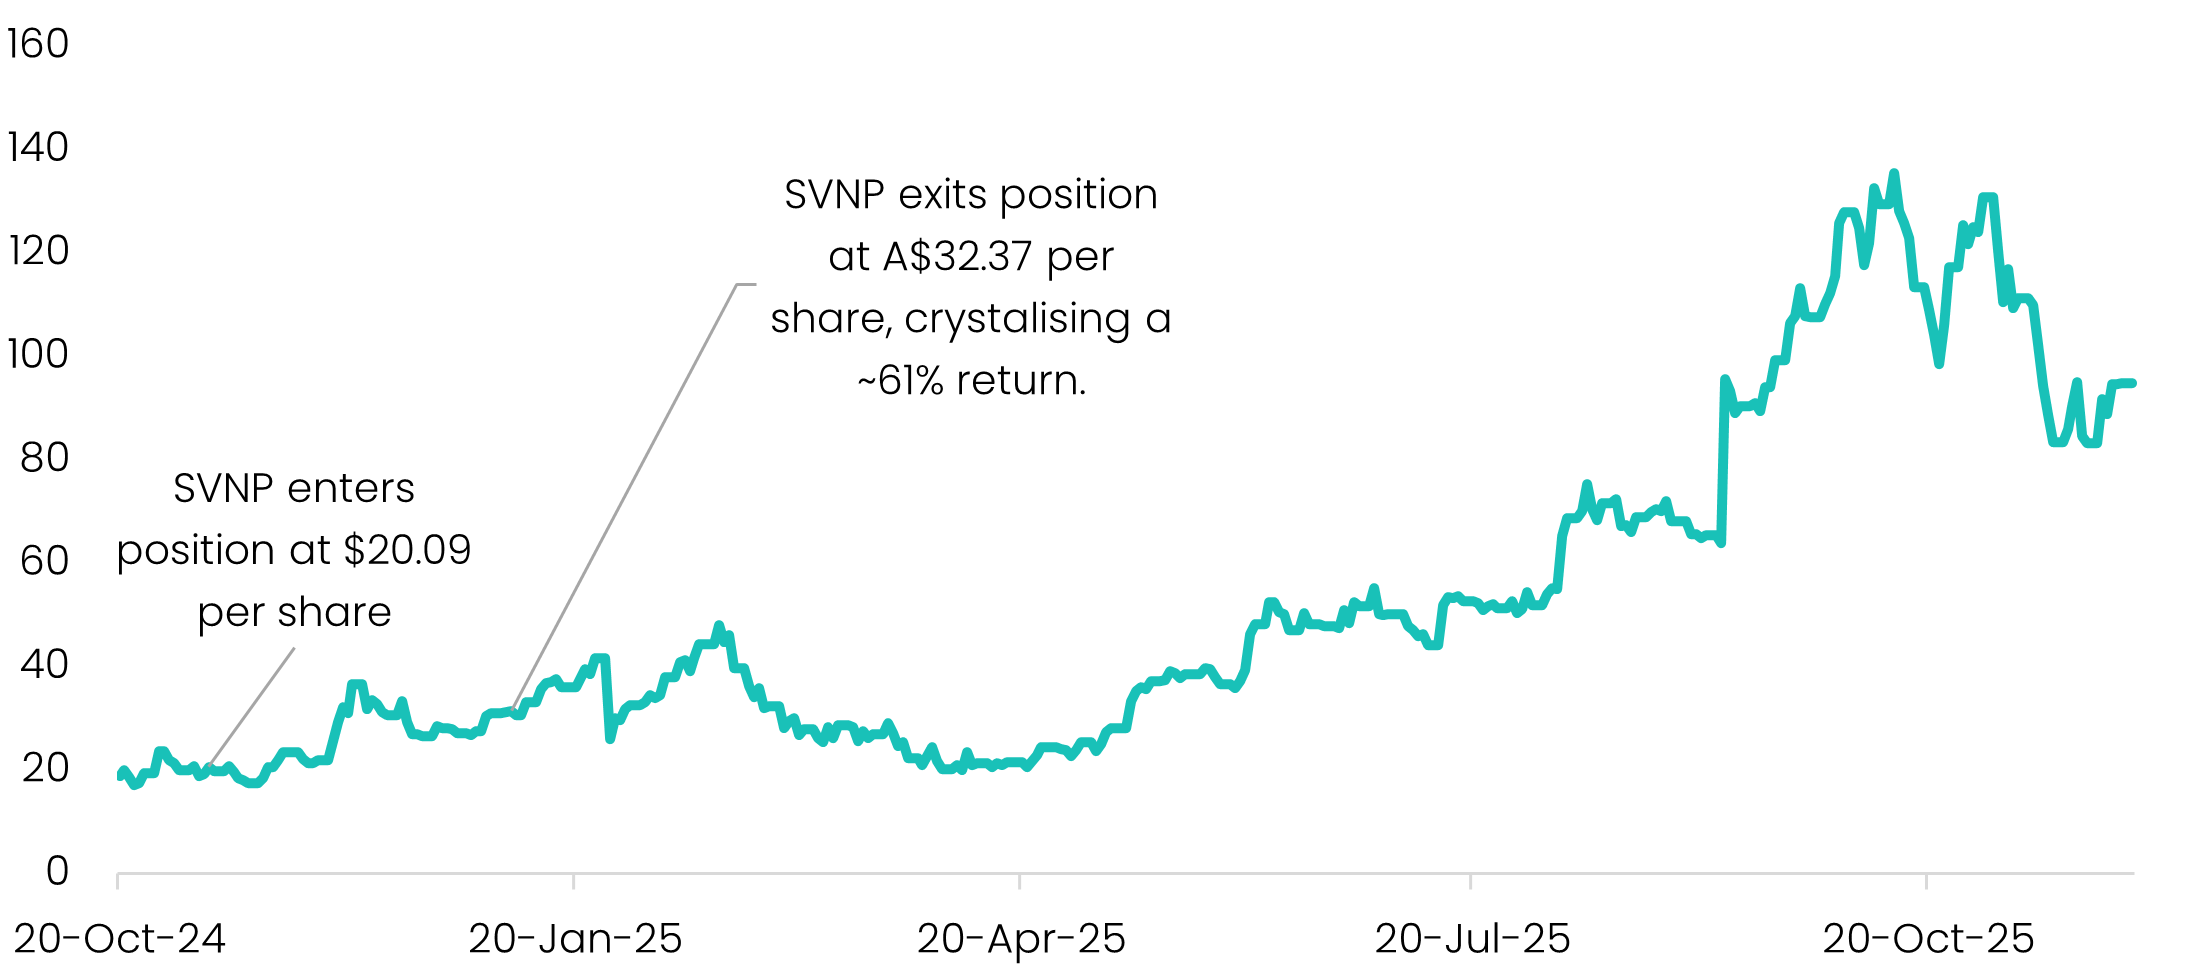
Source: Savana, S&P Global.
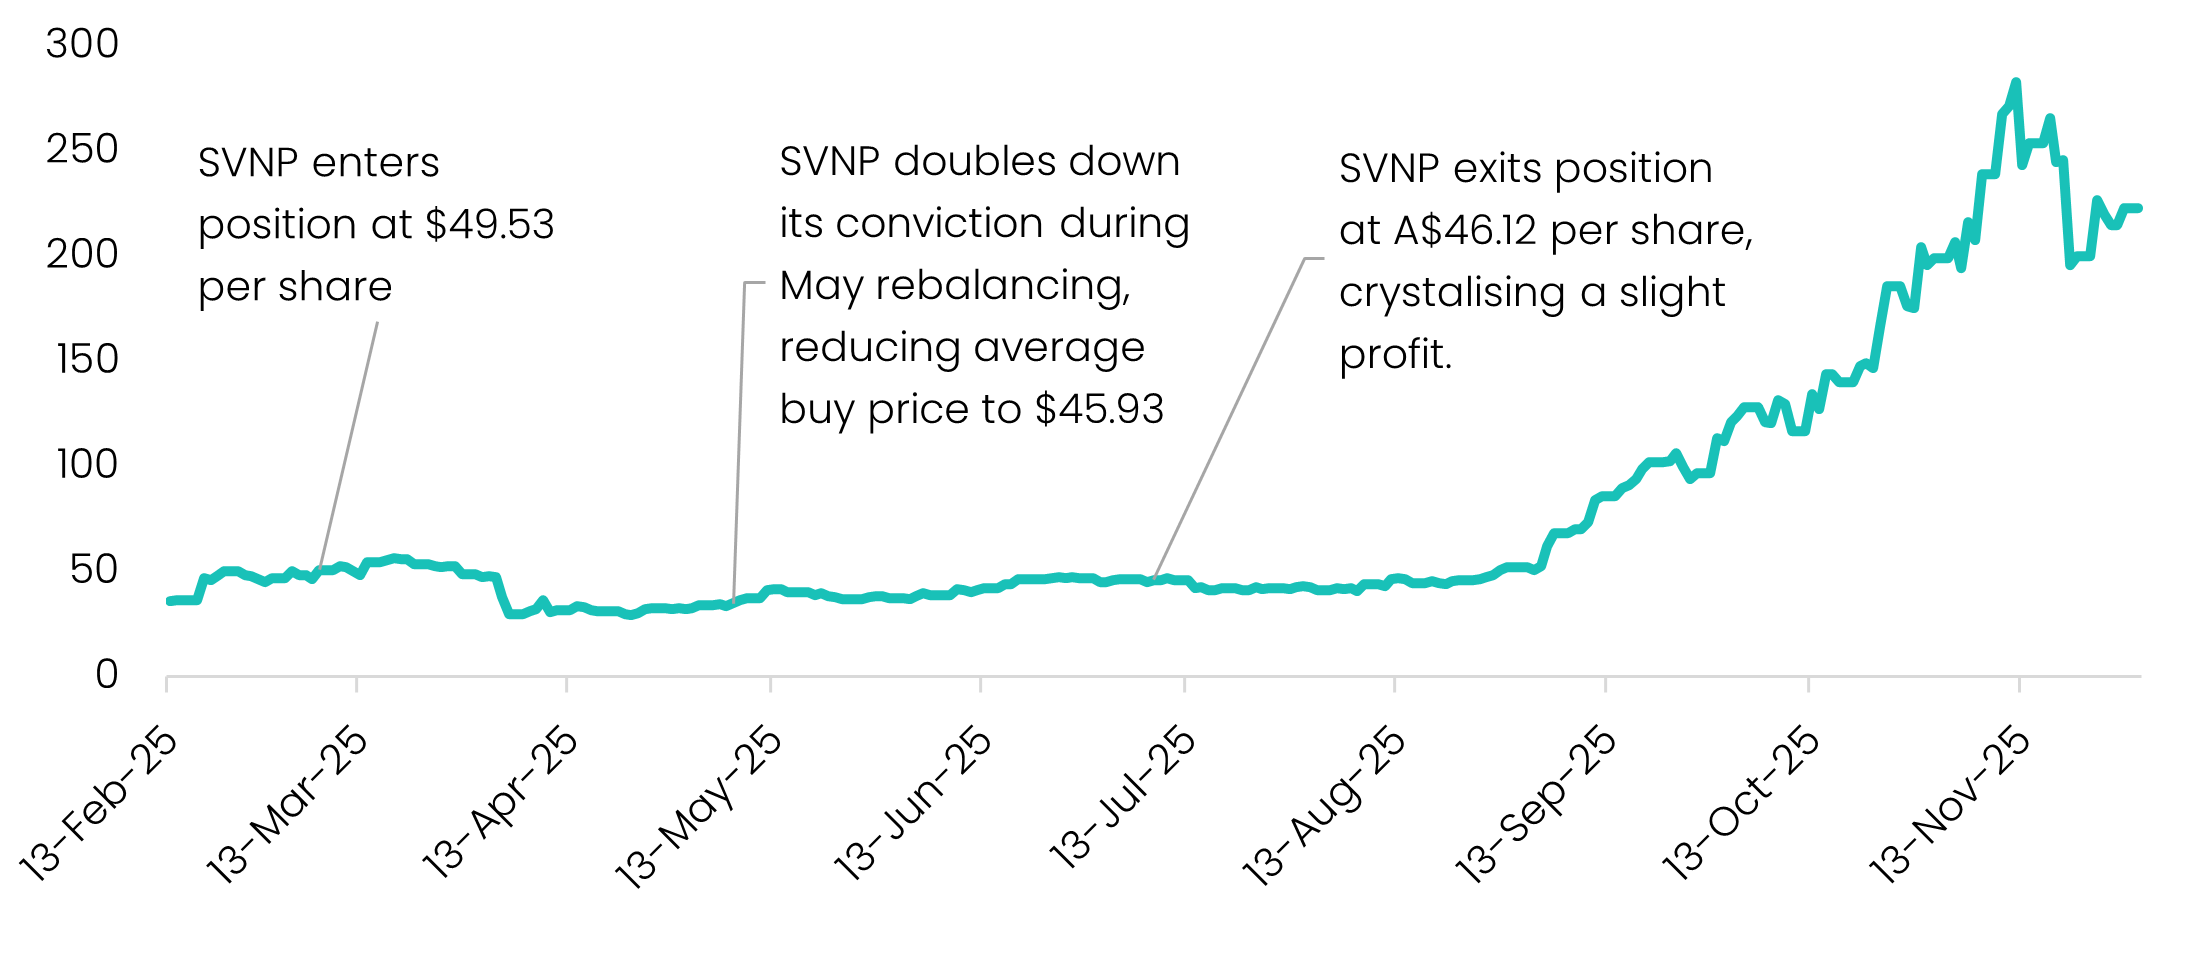
This one still hurts. Following its spin-off in February, we initiated a position in SanDisk three weeks later at $49.53 per share. As the market sold off through April–May, SNDK fell with it, retracing to around $30 at the trough. By July, the stock had recovered to roughly $46 per share. At that point, our algorithms identified more compelling mispriced opportunities elsewhere, and SNDK was narrowly excluded from the portfolio during the July rebalance.
If only we had held on.
Today, SNDK trades near $220 per share - approximately 4.5x our original entry point. SanDisk is another beneficiary of the broader AI-infrastructure boom, with its flash-memory and data-centre storage products experiencing a surge in demand. The company’s price-to-book ratio has expanded from 0.58 in March to over 3x today, reflecting this rapid re-rating.
Source: Savana, S&P Global.
Episodes like this offer a useful reminder of what our system is designed to do - and what it is not.
Our mandate, built on more than a decade of R&D, is to allocate capital to the 30 most undervalued opportunities in the addressable market at any point in time, based on a consistent, valuation-driven framework. That discipline is what underpins the long-term performance of the strategy.
However, this approach also entails trade-offs. A model that systematically rotates towards the most undervalued names will, by design, sometimes exit positions before their full upside is realised. The alternative - holding onto past winners in the hope of further gains - introduces discretion, path-dependency, and behavioural bias, all of which our strategy is deliberately built to avoid.
In short: our edge comes from valuing stocks better than the market and acting with unwavering consistency. While this occasionally means leaving some upside on the table, it is this discipline - not speculation - that drives the robustness of long-term returns.
With the rapid rise of Artificial Intelligence, an existential question now confronts the industry:
What does AI mean for the future of investment management?
Amidst the global ‘AI race’, a growing number of new entrants are promoting AI-driven research engines and decision tools that promise sharper insights, faster analysis, and a step-change in active management capability.
But beneath the froth and excitement lies a fundamental question: are today’s LLMs reliable enough to support - or meaningfully influence - live portfolio decisions? Their fluency is undeniable, but fluency does not guarantee the coherence, logic, or lateral reasoning required for real-world investing.
To explore this, we ran a controlled experiment. We asked Claude Sonnet 4.5 to generate Buy/Hold/Sell recommendations for 30 stocks using impartial, long-form research reports produced independently by ChatGPT. We then stress-tested those recommendations by:
1. Issuing repeated queries with identical input data
2. Introducing controlled lexical and structural rephrasings of the same reports
3. Applying positive and negative framing biases while preserving all underlying facts.
The outcomes were striking.
Our first test asked a basic question: does the model behave consistently when nothing changes?
The answer was mostly yes. Across 30 companies and repeated identical prompts, the model produced the same recommendation 97% of the time.
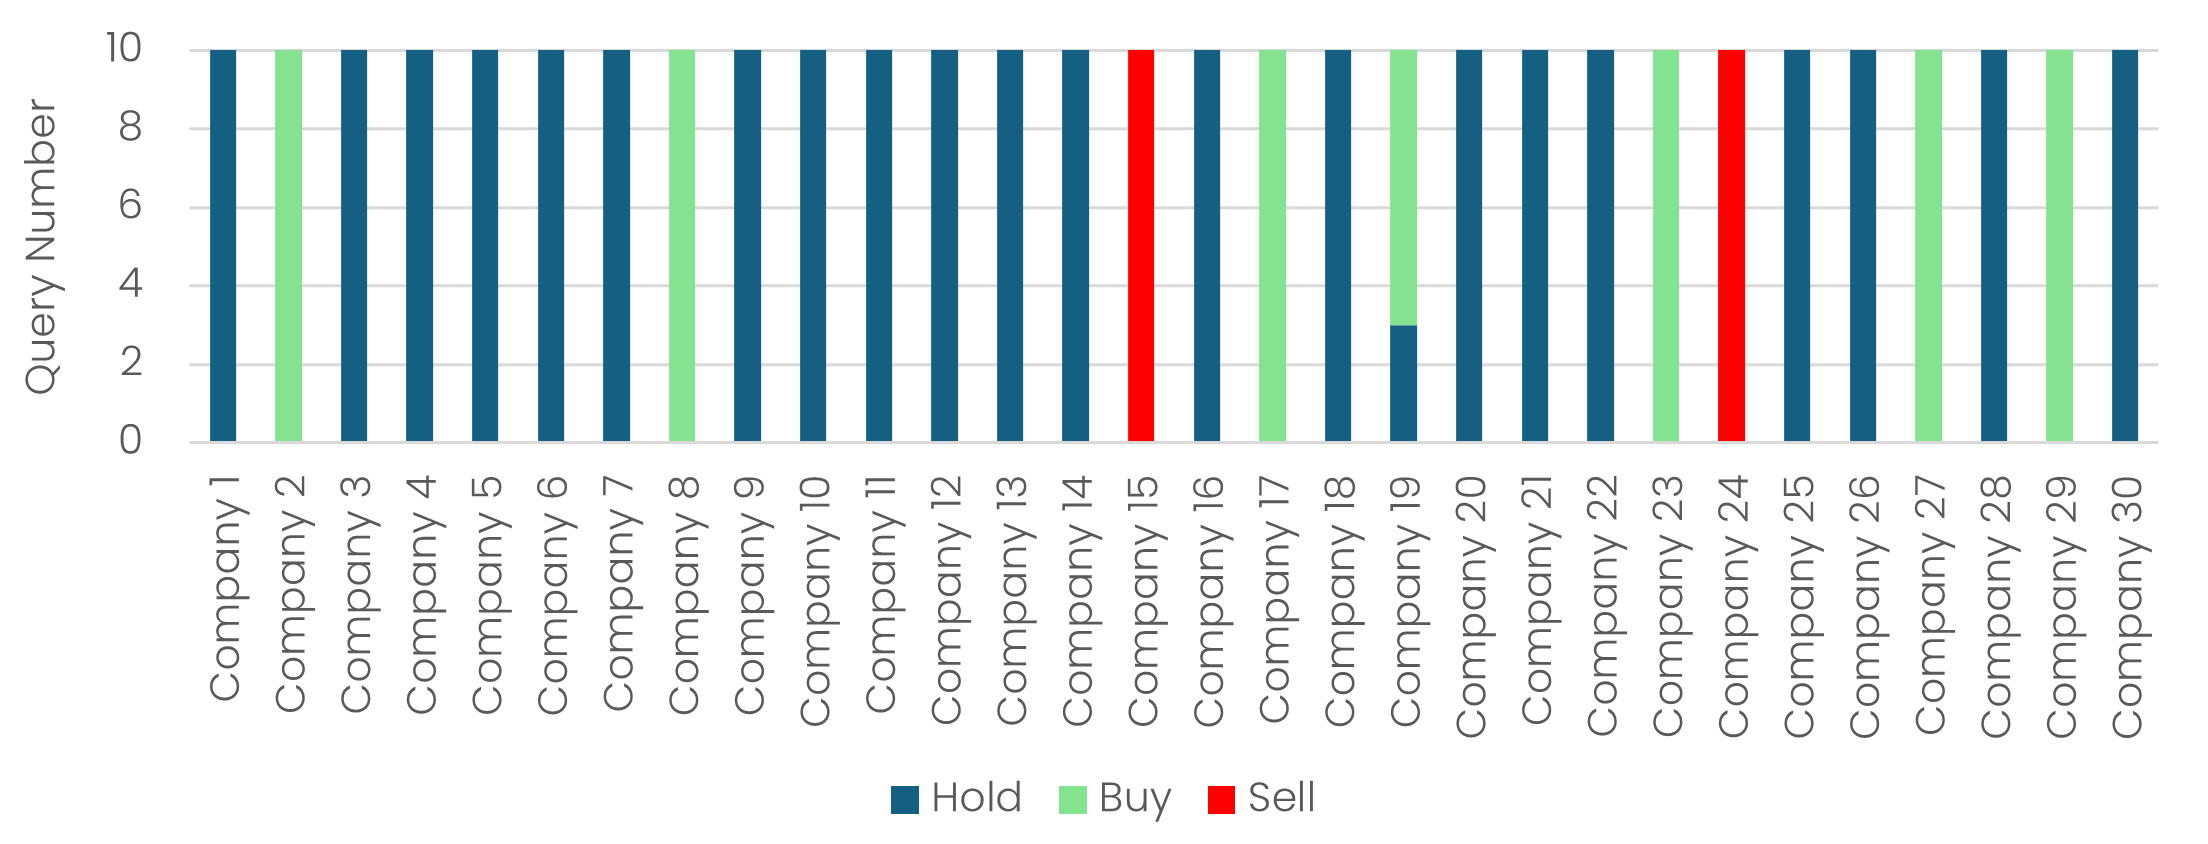
Only one company (Company 19) shifted (from “Hold” to “Buy”), showing that while LLMs are trained via stochastic processes, their inference-time behaviour is generally deterministic.
Takeaway: LLMs can be stable - but isolated “flips” remind us that determinism should not be assumed to be perfect.
Next, we tested whether the model’s decisions were robust to benign changes in wording. We re-wrote each research report four ways - reordered, rephrased, expanded, and condensed - while keeping all facts neutral and identical.
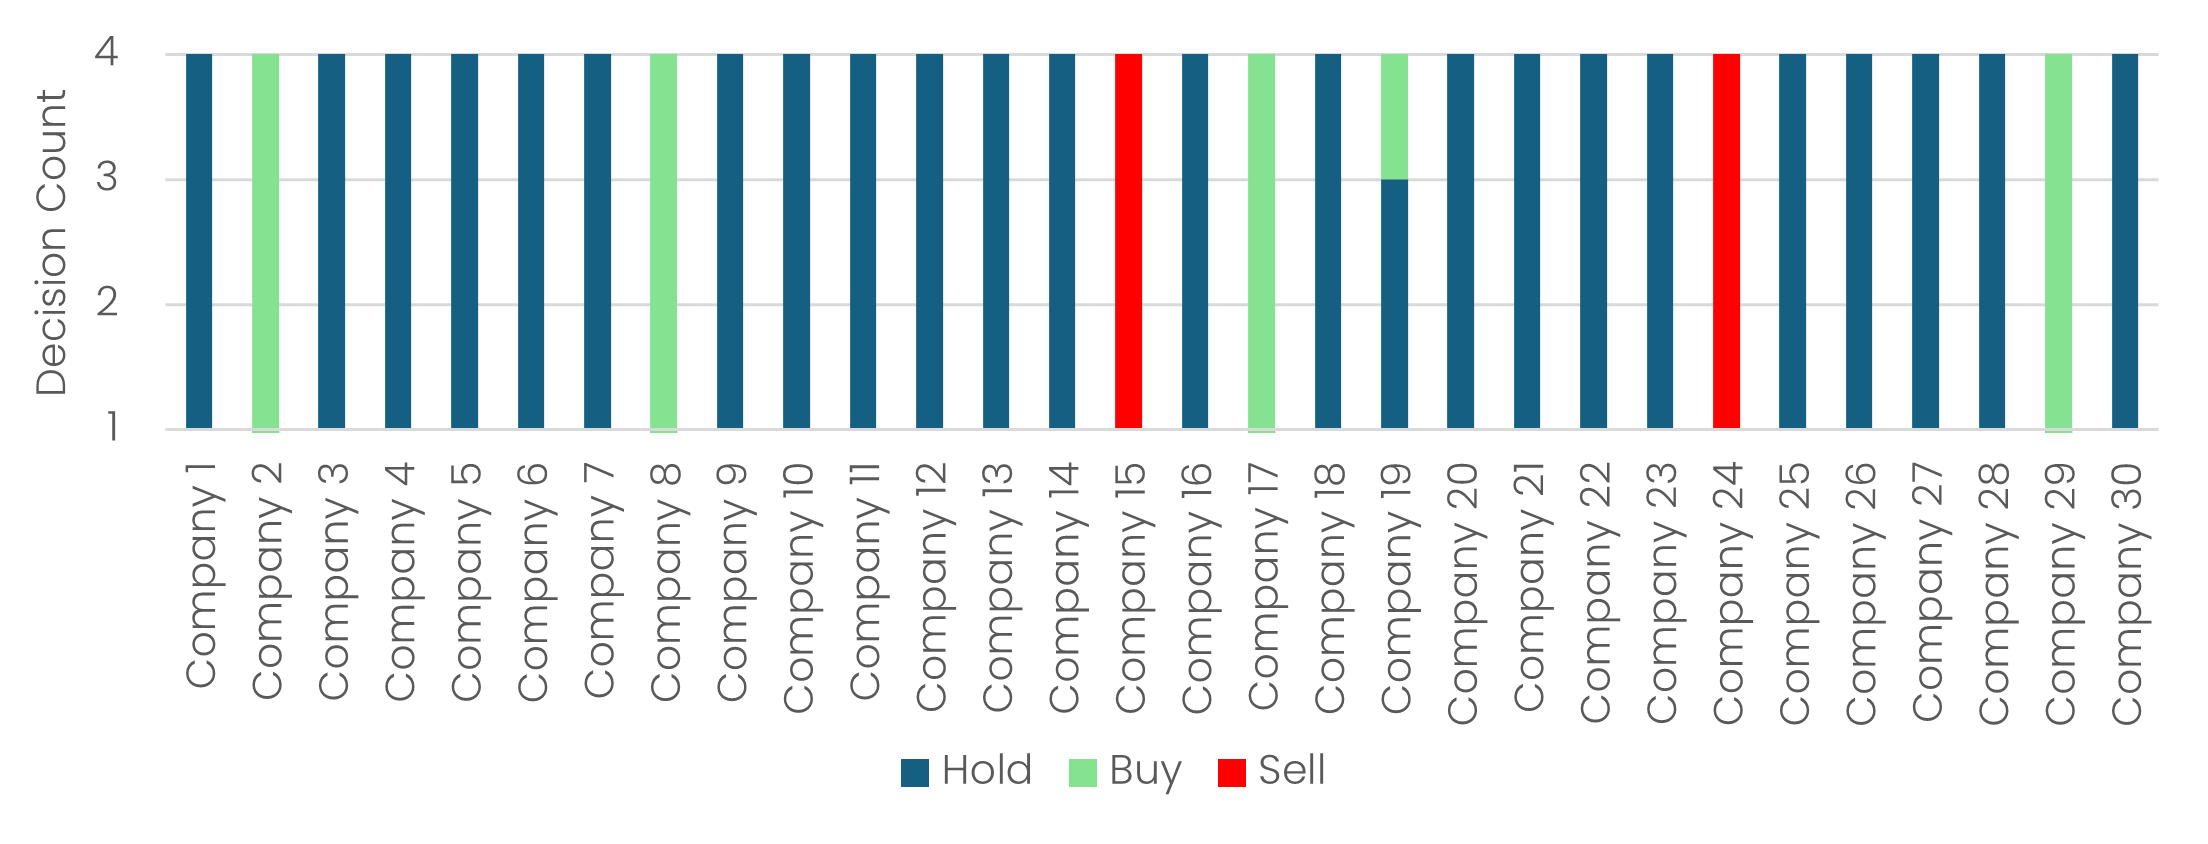
Here the cracks began to show.
About 17% of stocks experienced at least one change in recommendation due solely to neutral rewording. One company (Company 27) showed no robustness at all, flipping from its original “Buy” baseline to “Hold” under every version.
Takeaway: Current LLMs remain surprisingly sensitive to presentation rather than substance. Even subtle linguistic shifts - all factually identical - can meaningfully influence their decisions.
In real-world investing, information rarely arrives in a perfectly standardised format. The fact that small shifts in wording cause non-trivial decision flips suggest that LLMs do not yet possess the abstraction or invariance required for consistent investment decision-making.
Finally, we tested whether tone influenced the outcome. Each research note was regenerated twice: once with positively framed language and once with negatively framed language, while preserving all underlying facts.
Positive: “In November 2025, Kohl's appointed Michael Bender as its permanent CEO, following his successful interim leadership since May 2025.”
Neutral: “In November 2025, Kohl's appointed Michael Bender as its permanent CEO, following his interim leadership since May 2025.”
Negative: “In November 2025, Kohl's appointed Michael Bender as its permanent CEO, following his interim leadership since May 2025—making him the fourth CEO in four years, a troubling pattern that raises concerns about strategic continuity.”
The impact was material.
Positive and neutral framing produced similar distributions of recommendations. But negative framing caused a heavy skew toward Sell, despite the factual content being unchanged.
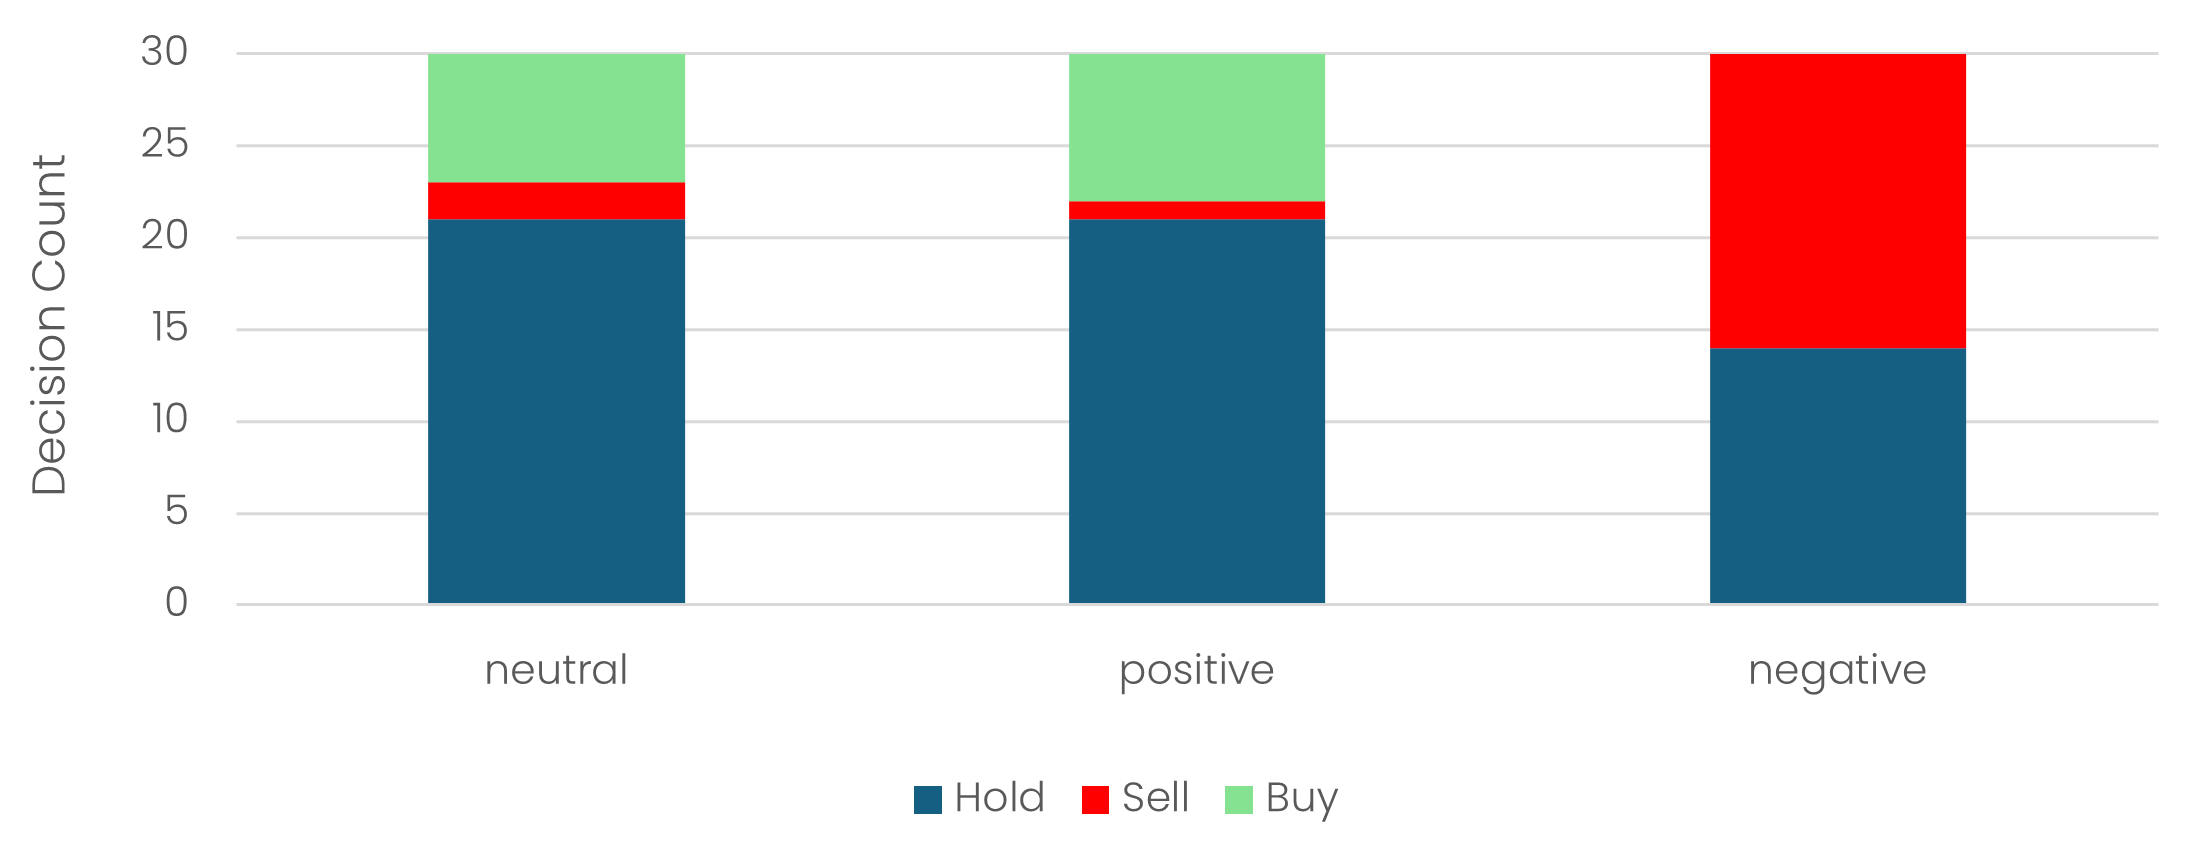
Takeaway: LLMs respond strongly to sentiment cues. When language becomes even slightly cautious or risk-emphasised, their recommendations shift accordingly. In real markets - where tone, emphasis, and sentiment vary constantly - this creates a material vulnerability.
Across the three tests, a clear conclusion emerges: LLMs are generally stable when fed identical inputs, yet they remain highly sensitive to how information is presented. Even small, neutral shifts in wording caused decision flips in a meaningful number of cases, while negative framing pushed many recommendations toward Sell despite the underlying facts being unchanged. Taken together, this suggests that today’s models are not robust enough to act as independent investment decision-makers without very careful input control.
So, while LLMs certainly add genuine value as research accelerators - helping synthesise information, surface signals, and streamline workflows - as engines for live portfolio allocation, they still lack the consistency, abstraction, and invariance required for dependable use.