
Join Savana.
Subscribe to our monthly newsletter to receive the latest updates and insights.
Subscribe to our monthly newsletter to receive the latest updates and insights.
30 September 2025

1. The Smart Satellite: how SVNP can complement your core portfolio
2. Savana’s Valuation Radar: how the mega-caps measure up
3. Let it Rain: More M&A in SVNP
Many investors focus on the challenge of picking the “right” individual stocks. Yet, the interaction of those stocks - how they are weighted and correlated – is often overlooked. The allocation of capital across assets not only affects the pattern of returns, but also a portfolio’s ability to withstand different market conditions. In this sense, allocation can be just as important as individual stock selection.
This principle underpins Modern Portfolio Theory (MPT). Our trusty friends at Wikipedia define Modern Portfolio Theory as a “mathematical framework for assembling a portfolio of assets such that the expected return is maximized for a given level of risk.” The intuition behind the mathematics is relatively straightforward; portfolio returns are simply the weighted average returns of the individual stocks, while portfolio risk is a function of both the variance of the individual stocks and crucially, how those stocks are correlated with each other. For all you maths geeks out there, here’s some expressions (assuming you hold two assets, A & B):
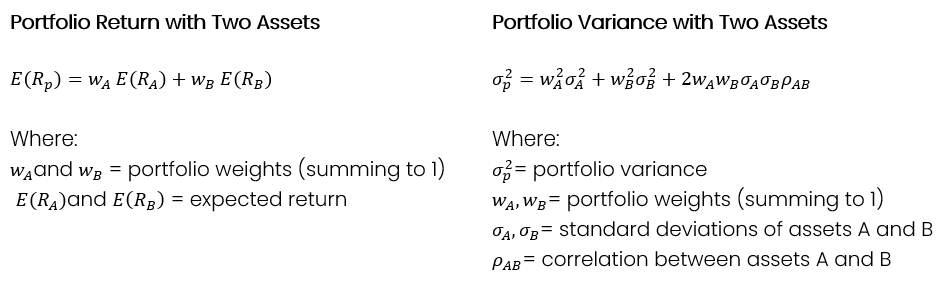
Risk-adjusted returns are commonly measured by the Sharpe Ratio, which is the portfolio’s excess return over the risk-free rate, divided by its standard deviation.
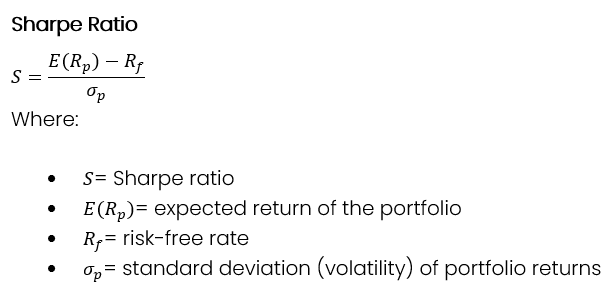
This equation goes to the heart of modern portfolio theory: by allocating to securities with low correlation, you can reduce portfolio risk (the denominator of the Sharpe ratio) and boost the overall risk-adjusted return.
Thus, the key lies in correlation! If two investments are not perfectly aligned, their price movements will partially offset each other, smoothing the ride for investors.
- Perfect correlation (1.0): no diversification benefit - both assets move together.
- Low to moderate correlation (0.2–0.7): diversification benefit - one asset’s drawdowns are cushioned by the other.
- Negative correlation (<0): rare in equities, but theoretically the strongest diversifier.
The “sweet spot” for equity portfolios is typically found in that low-to-moderate range, where assets still participate in broad market growth but do so on different terms.
Enter Savana. Our algorithmic, contrarian focus on undervalued US small caps mean we often moves differently from typical core portfolio holdings like the ASX 200 and S&P 500 indices. As capital allocation in the US market broadens out (led by monetary easing and a rebalancing out of top-heavy big tech), we believe that SVNP stands out as being highly accretive in modern portfolio construction.
Let’s test!
The below table sensitizes the Sharpe Ratio of a hypothetical portfolio over the last three months, based on its percentage allocation to the S&P 500 and SVNP. As illustrated in the table, if you allocated 100% of your portfolio capital to the S&P 500, your Sharpe Ratio would be 1.39, whereas if you allocated 100% to SVNP, your Sharpe Ratio would be 1.20. While many investors might simply select the S&P 500 in this instance, the table shows that it is in fact a combination of both securities that yields the highest risk-adjusted return – in this case, 80% in the S&P 500 and 20% in SVNP. The key ingredient? A moderately low correlation of 0.37.
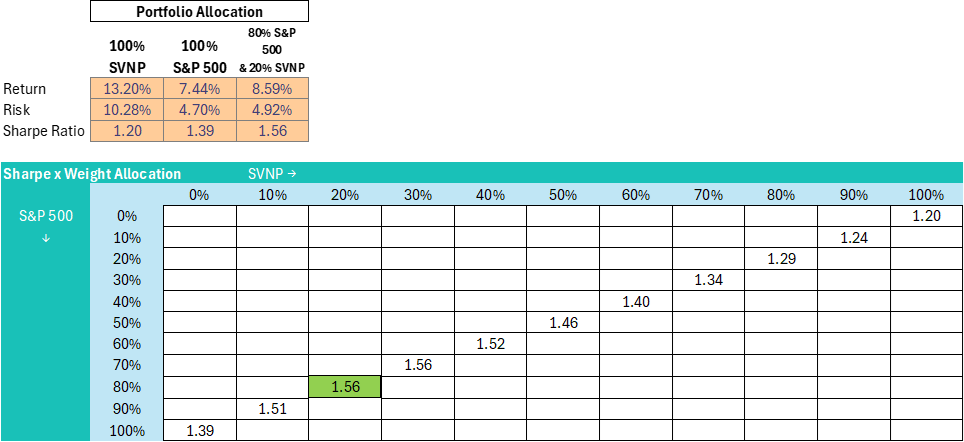
Source: S&P Global, Savana. Calculated on daily returns between 30-Jun-25 to 30-Sep-25. Sharpe ratio is based on 3-month RBA rate.
Modern portfolio theory is, however, not without criticism - in particular, that it evaluates portfolios based on variance rather than downside risk. After all, if your variance is driven by strong gains, you’re probably not feeling overly risky! This brings us to post-modern portfolio theory, which is also a portfolio optimization methodology, but using downside risk rather than mean variance. Instead of using the Sharpe Ratio, risk-adjusted returns are measured by the Sortino Ratio, which simply replaces the standard deviation of returns with the standard deviation of negative returns.
Sortino Ratio
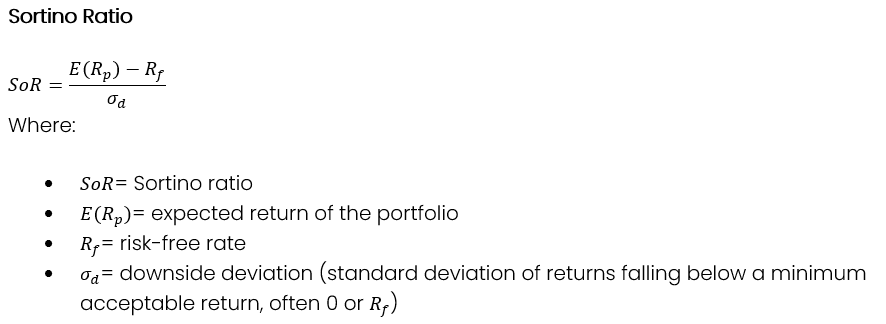
So how does SVNP compare under this revised condition? Adjusting to consider downside risk only, SVNP exhibits a higher Sortino Ratio than the S&P 500 over the three-month period (2.32 versus 2.03), suggesting a superior risk-return profile. Still, it is shown that the Sortino Ratio is maximised by allocating across both securities, with a ~40-50% allocation to SVNP (and a ~50-60% allocation to the S&P 500) yielding an optimised Sortino of 2.65.
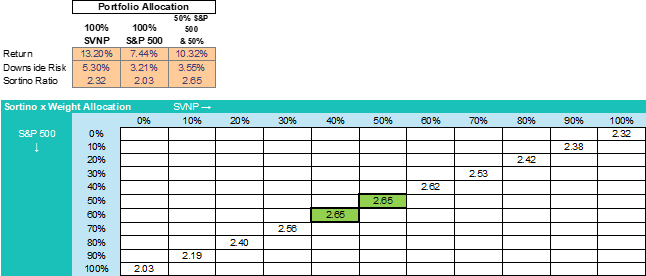
Source: S&P Global, Savana. Calculated on daily returns between 30-Jun-25 to 30-Sep-25. Sortino ratio is based on 3-month RBA rate.
It is important to note that, even after adjusting for downside risk, portfolio theory has its limits. It’s inherently backward-looking, and correlations can shift over time. Still, the core message is powerful: the mix matters. That’s exactly where SVNP fits in. In practice, SVNP works best as a satellite allocation alongside established core holdings. By adding exposure to differentiated assets, investors can broaden their opportunity set and build greater resilience into their portfolios.
Savana’s automated valuation engine can evaluate entire markets in a matter of minutes, pinpointing the most undervalued opportunities. Typically, this algorithmic process shines a spotlight on the bottom end of the market — the overlooked, the unloved, the deprived.
But every so often, for a bit of fun, we turn the lens upward. How do the market’s heavyweights stack up when put under Savana’s valuation radar? Which giants look stretched, and which may still offer value? What insights can be drawn? Let’s find out!
Below is a chart mapping the top 20 US-listed companies by market cap. The X-axis represents Savana’s algorithmic valuation probability (further left = greater probability of being undervalued). The Y-axis shows the company’s market capitalisation.

Source: S&P Global, Savana. As of 15-Sep-25.
Here are our three key take-aways:
Microsoft: the standout among the ‘Magnificent Seven’ - While much of the conversation centres on Alphabet’s relatively low P/E ratio, Savana’s algorithm identifies Microsoft as the most attractive opportunity within the Mag-7 cohort. At the other end of the spectrum, Tesla screens as the least compelling on valuation grounds.
Financials come at a premium - Major financial institutions such as JPMorgan, Visa, and Mastercard sit toward the overvalued end of the scale. This suggests investors may be paying a premium for perceived safety, scale, and dominance in payments and banking.
Buffett still has it - Berkshire Hathaway stands out as the most reasonably priced among the mega-caps. How fitting that our digital-age valuation engine tips its hat at one of the great standard-bearers for traditional value investing.
So, that’s the US. But how about our own backyard here in Oz? Here’s what our algorithms tell us:
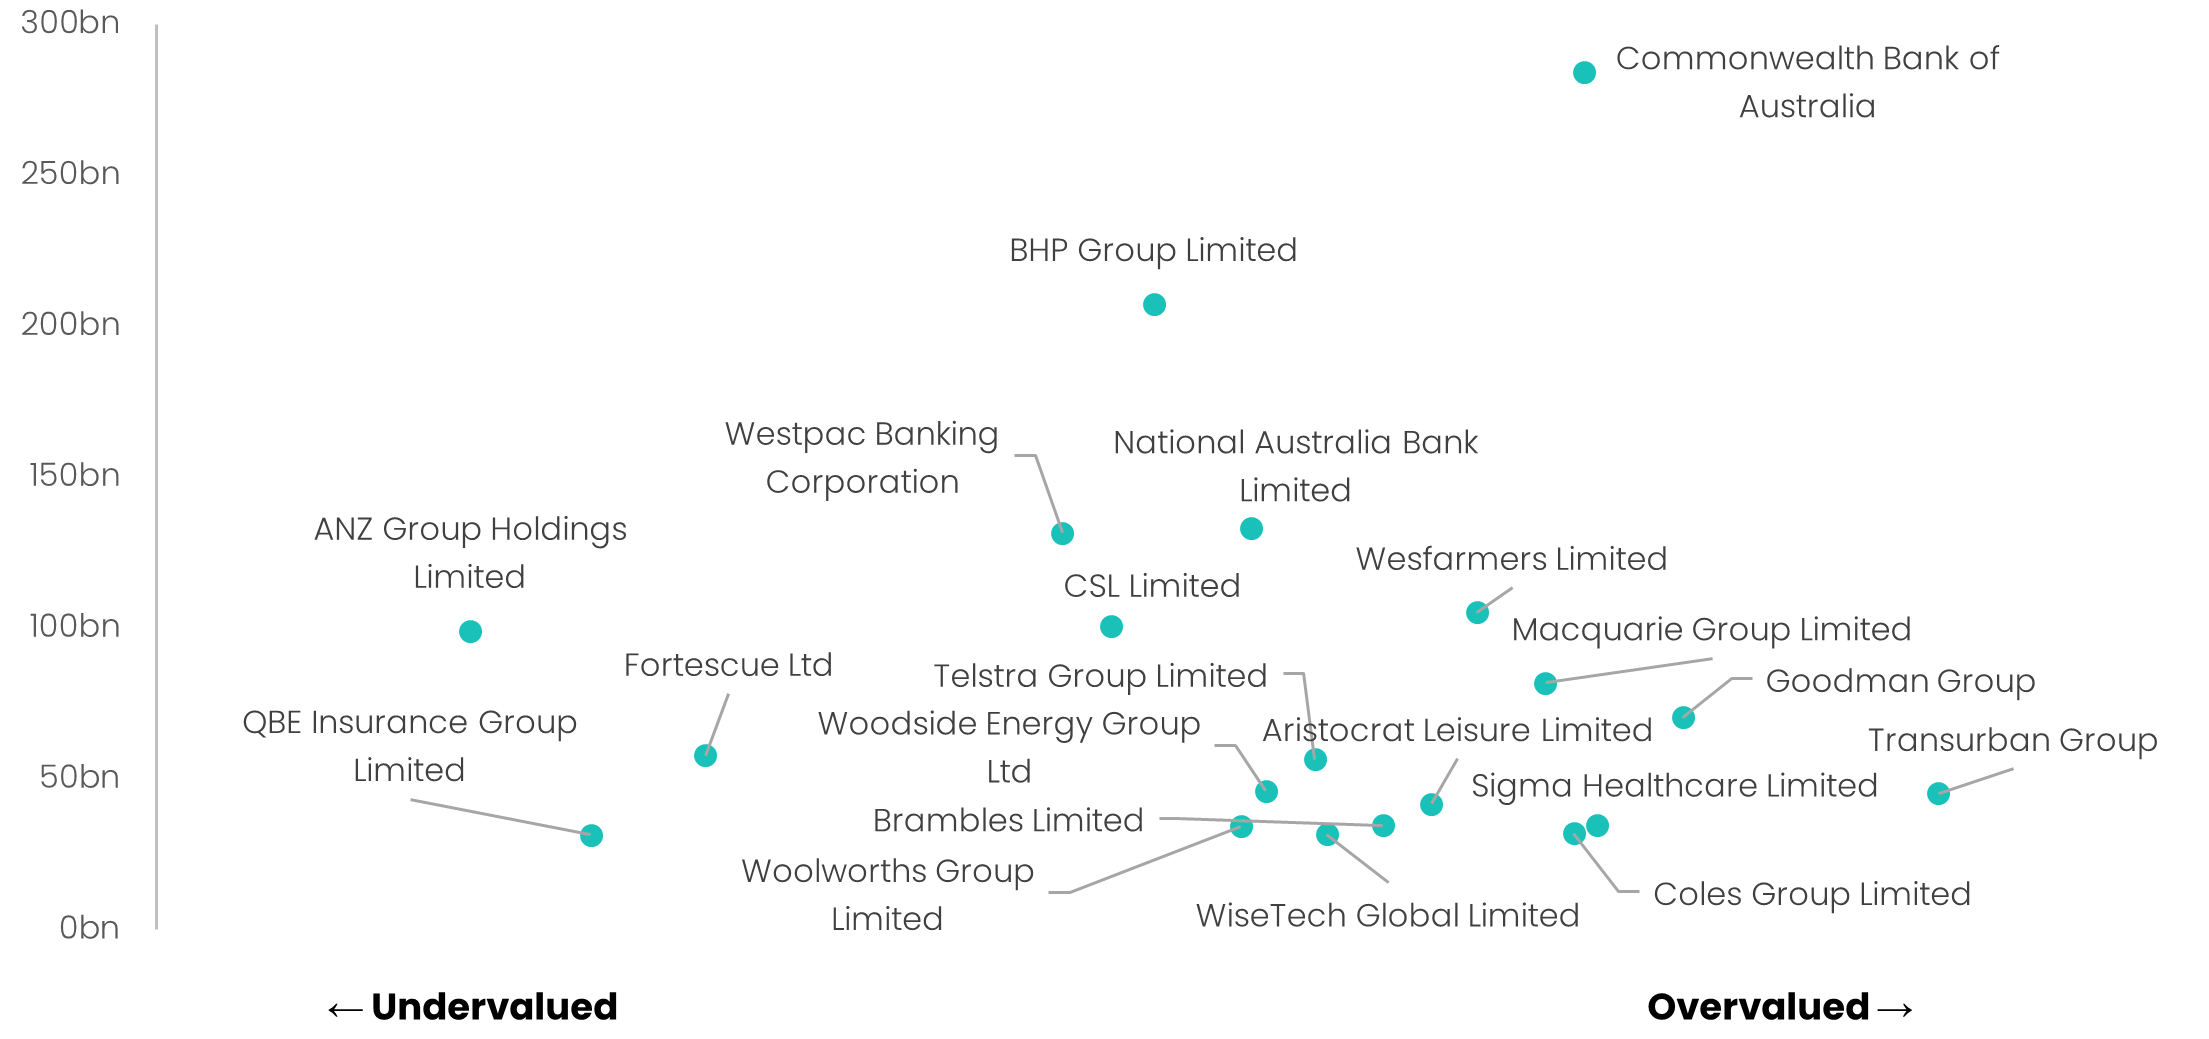
Source: S&P Global, Savana. As of 15-Sep-25.
The Big Splinter in the ‘Big Four’ – Australia’s largest commercial banks (Commonwealth, NAB, Westpac and ANZ) have historically traded in lockstep. But in recent times, valuations have become dispersed. Commonwealth, recently dubbed the “most expensive bank in the world,” sits clearly at the premium end. ANZ, meanwhile, lags behind as it works through a leadership transition, A$500m+ in restructuring charges, and a recent A$240m ASIC settlement.
Paying a Toll for Stability - Australia’s largest toll-road operator, Transurban, continues to attract a premium valuation thanks to its long-duration concessions, inflation-linked revenues, and near-monopoly assets across major cities. Yet recent results highlight the trade-off: net profit fell over 50% despite revenue growth, as higher finance costs and operating expenses bit into margins. Investors appear willing to pay up for stability - but the stock screens firmly toward the overvalued end of our radar.
QBE Sitting Pretty – Our algorithms flag QBE as one of the most compelling value opportunities among the top 20. In its June quarterly, the insurer posted a 27% uplift in net profit, with volumes, margins, and claims all ahead of expectations. That caps off a stellar three-year run, with revenue up 43% and net profit surging 155%. So why the market discount? Perhaps it reflects broader industry pressures (the first half of this year was the most expensive claims period for global insurers in a decade) with heightened risks from geopolitical tensions, extreme weather events, and escalating cyber threats all weighing on sentiment.
Last month, we discussed the prevalence of M&A events in Savana portfolios. This month, as if to punctuate the point, a further two companies – ODP Corp and Brighthouse Financial – were subject to takeover bids. This brings the total number of corporate action occurrences in SVNP to 8 since inception of the fund in November 2024, representing a 12.7% strike rate based on the number of unique holding (63).
As outlined last month, we believe that our valuation methodology naturally tilts toward attractive M&A targets, providing a powerful lever for capital growth through synergies, value accretion and share price premiums typically realised at sale. ODP and Brighthouse are standout examples…
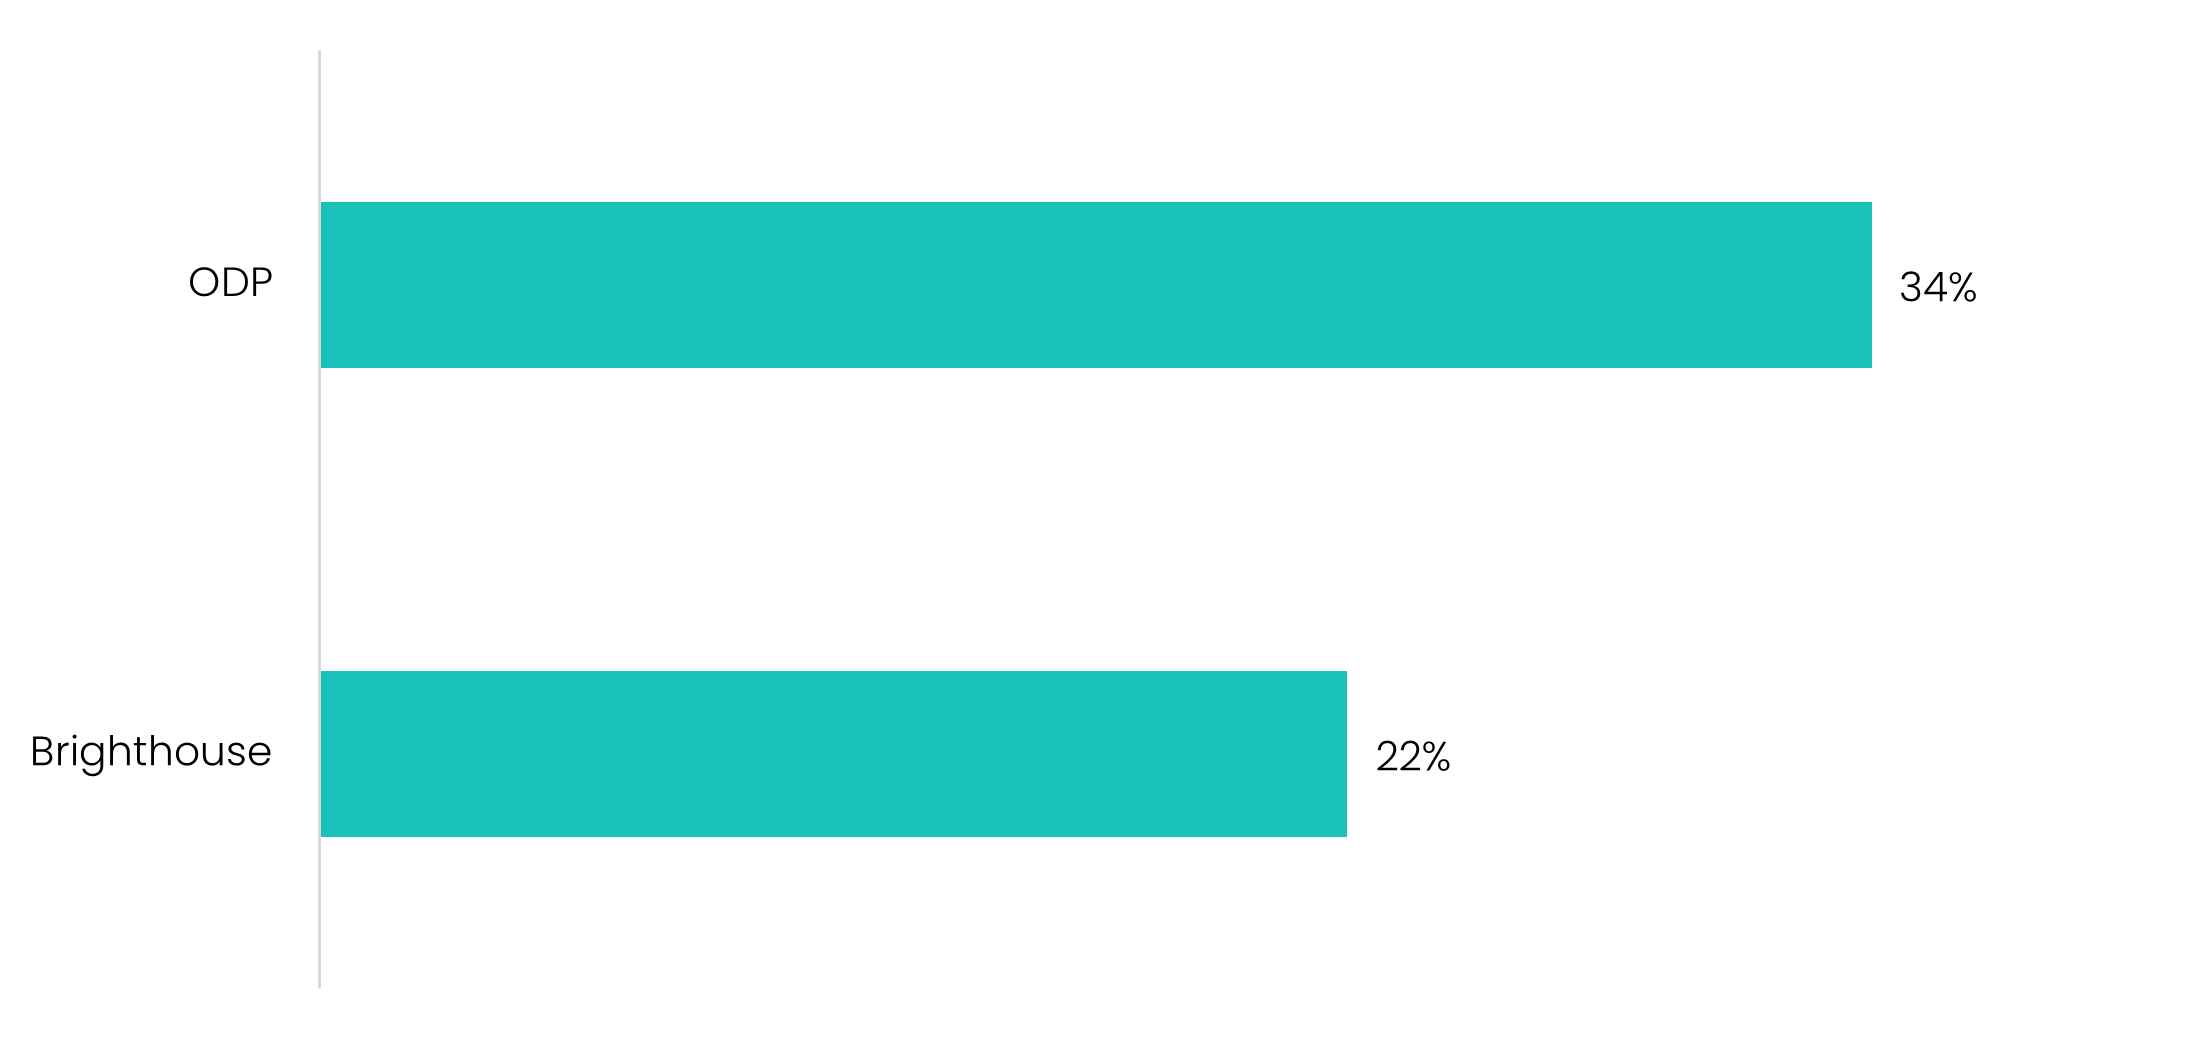
Source: S&P Global. Up to 30-Sep-25.
ODP, the parent company of Office Depot and OfficeMax, has been navigating a long-term structural decline in the office supplies sector. Its undervaluation, stable cash flows, and sizable retail and distribution presence made it a classic private equity target. In September, Atlas Holdings (a PE company focussed on manufacturing and distribution industries) announced an all-cash acquisition valued at roughly US $1 billion (US $28/share), equating to a 34% premium to ODP’s pre-announcement price. In their announcement, Atlas cited its ability to accelerate ODP’s B2B initiatives and transition from traditional retail as the key value driver of the transaction. The deal underscores how companies that are heavily discounted by public markets often hold significant hidden value that can be extracted under the right shareholder, structure or strategy. By targeting undervalued companies, Savana positions exactly for these kinds of turnaround, asymmetric opportunities.
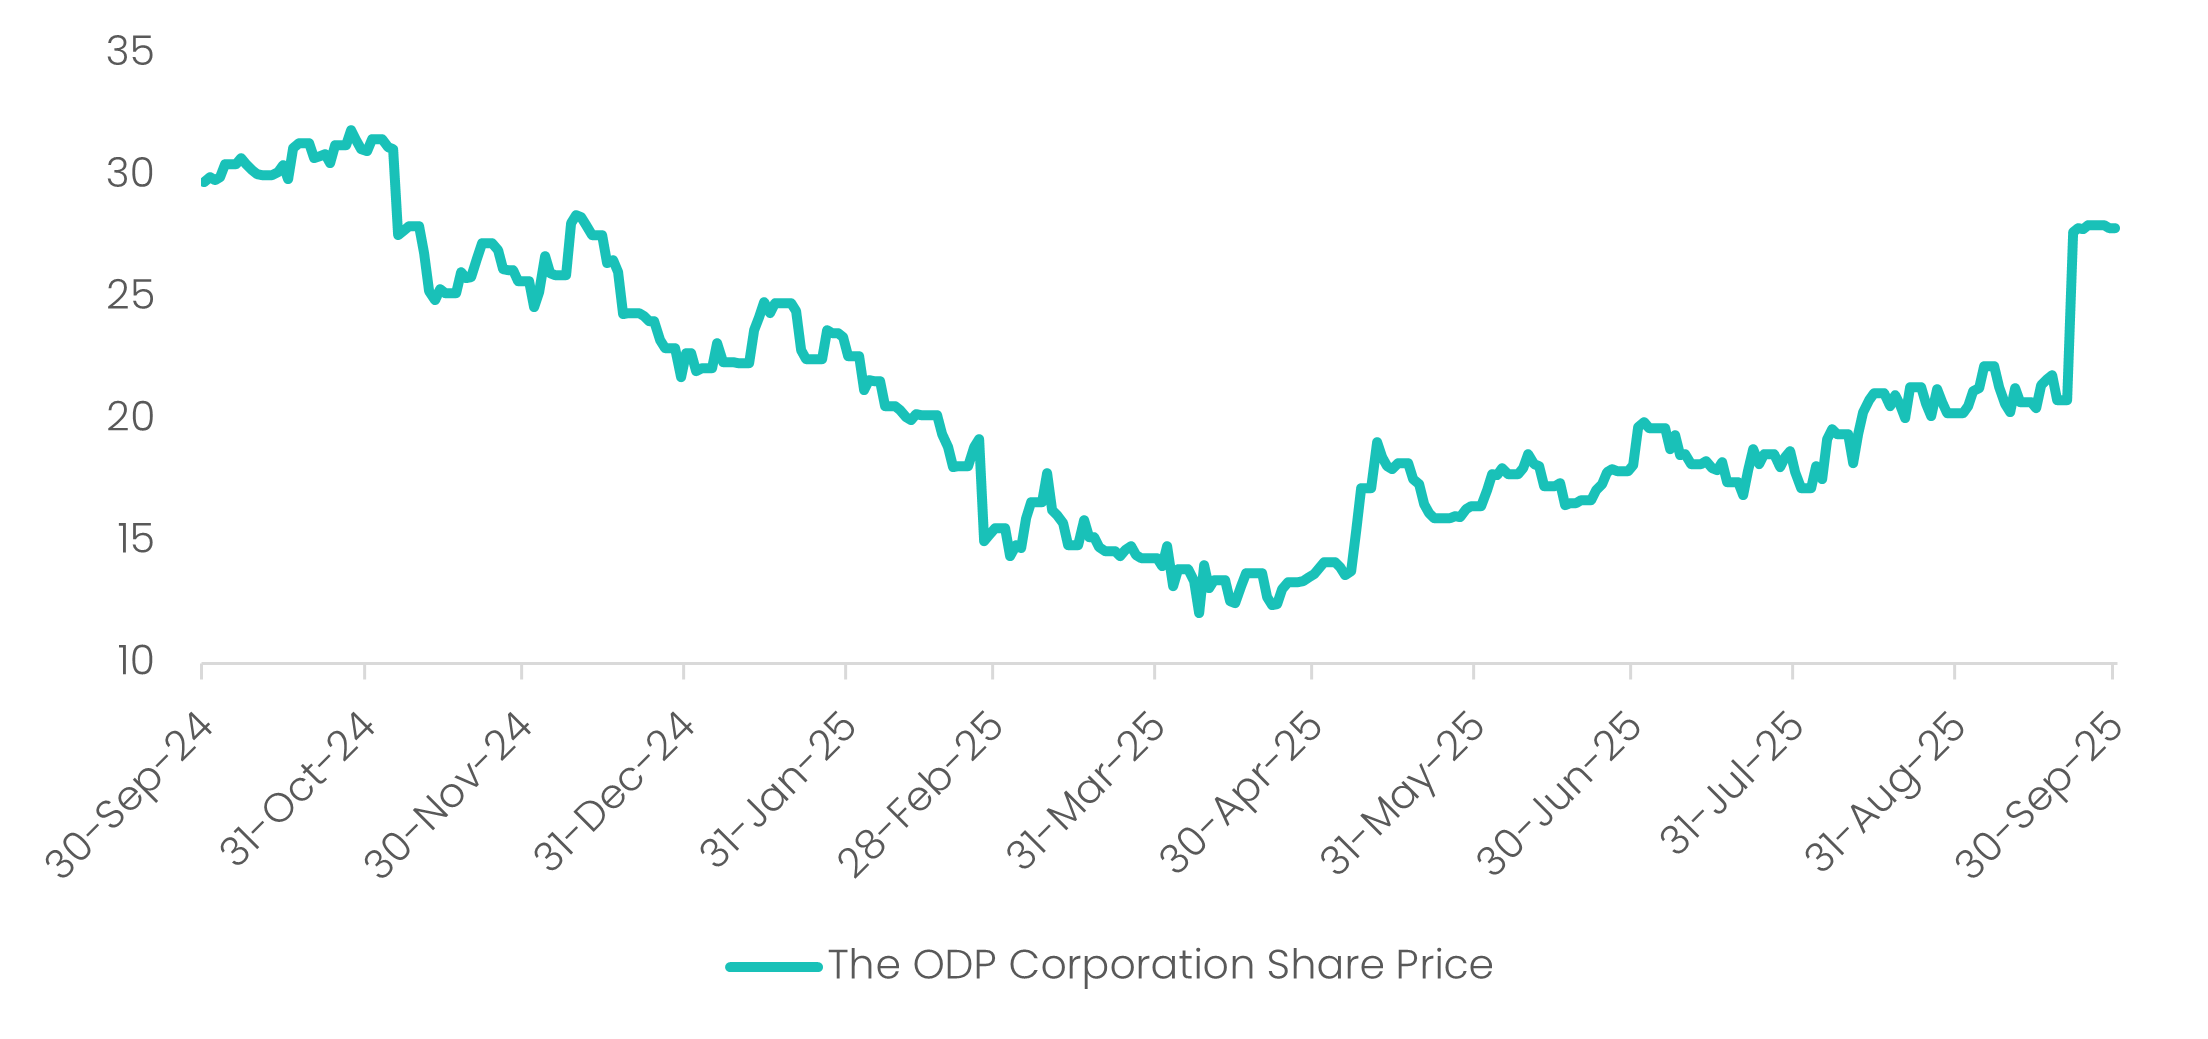
Source: S&P Global. Financial metrics are Pre-announcement as at 12-Sep-25.
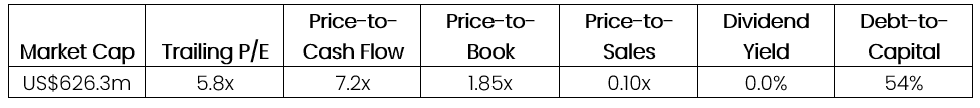
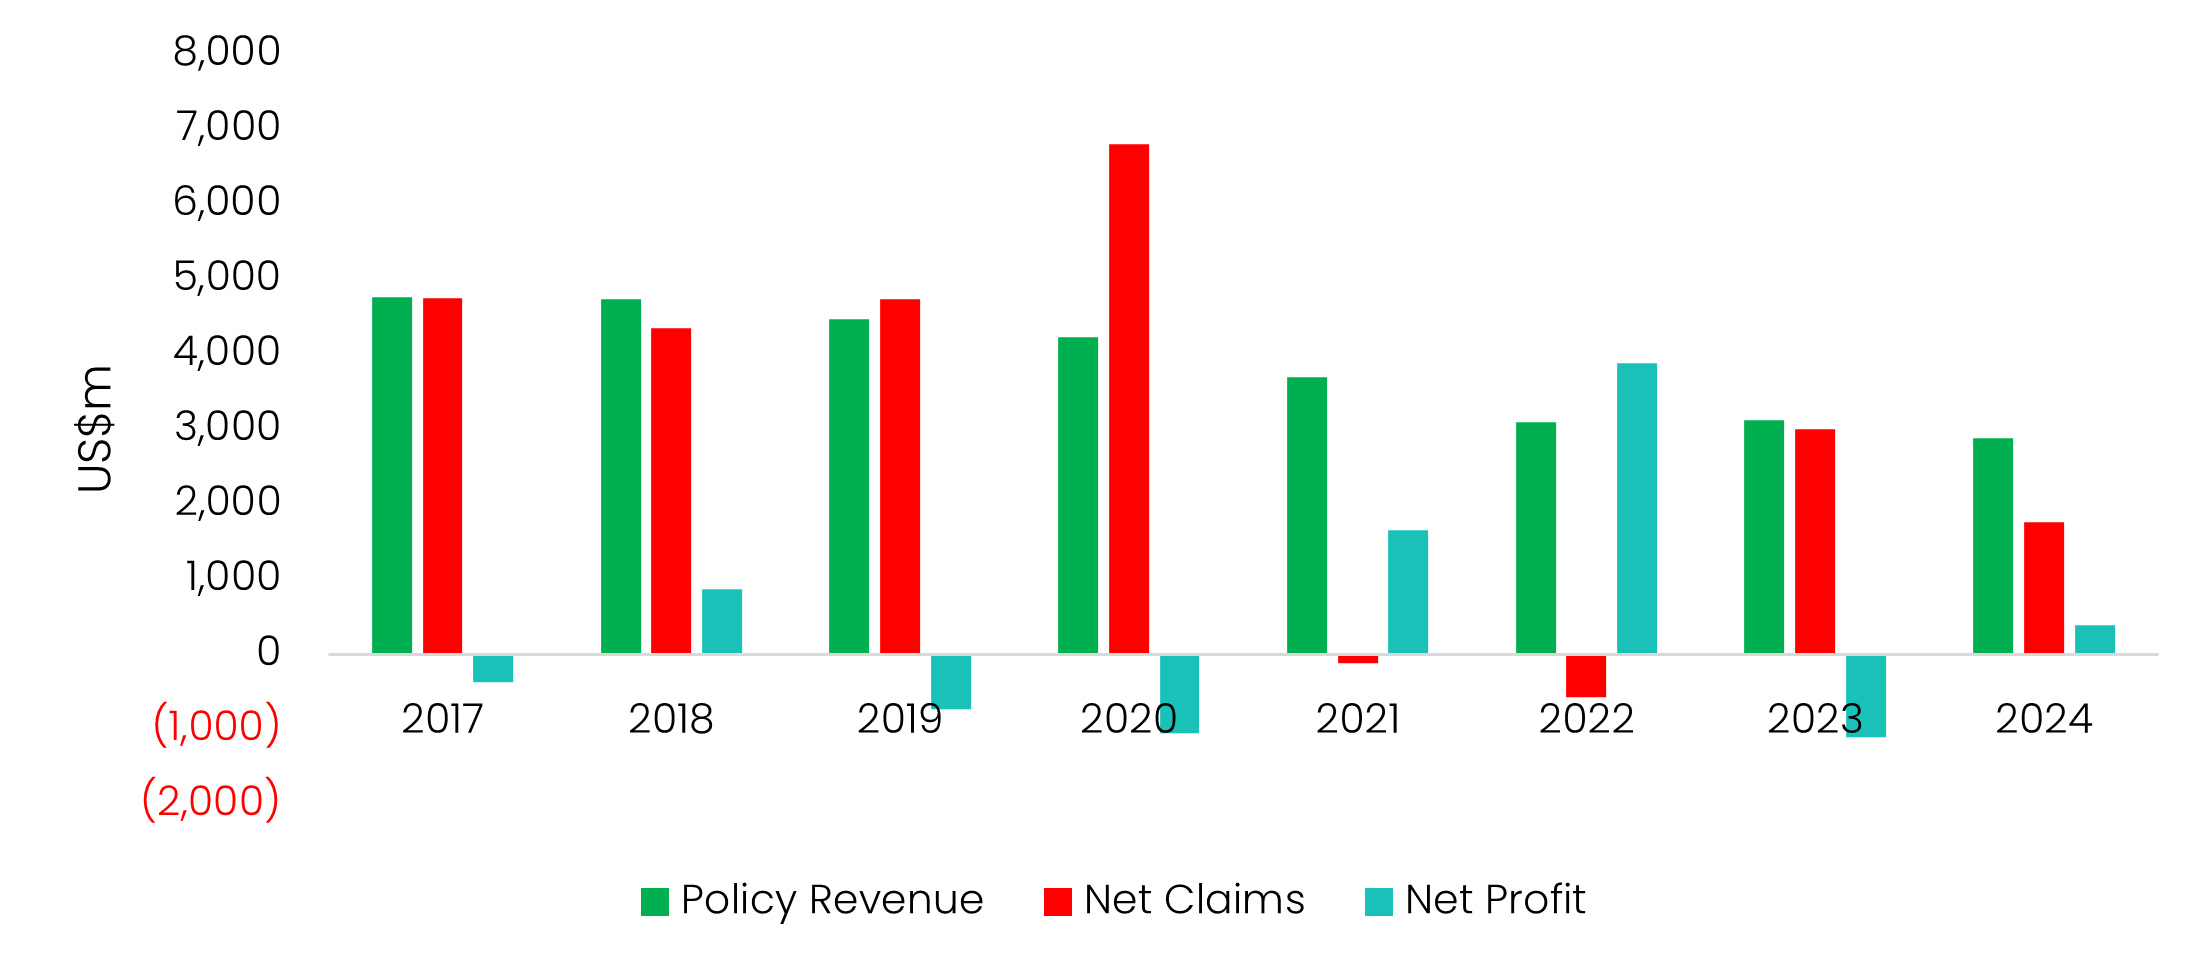
Brighthouse is one of the largest life insurance companies in the US, with balance sheet investment assets of over US $100bn. Originally spun out of global insurance giant, Metlife, in 2017, Brighthouse has been challenged in recent years by stagnant revenue growth and lumpy profitability led by erratic annual claim payouts. Accordingly, the company has long traded at a significant discount to peers.
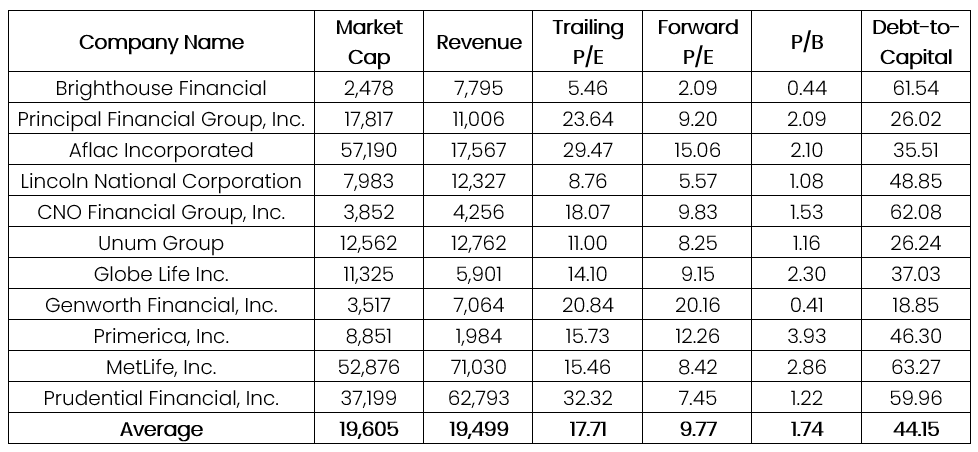
Source: S&P Global. Financial metrics are Pre-announcement as at 7-Sep-25.
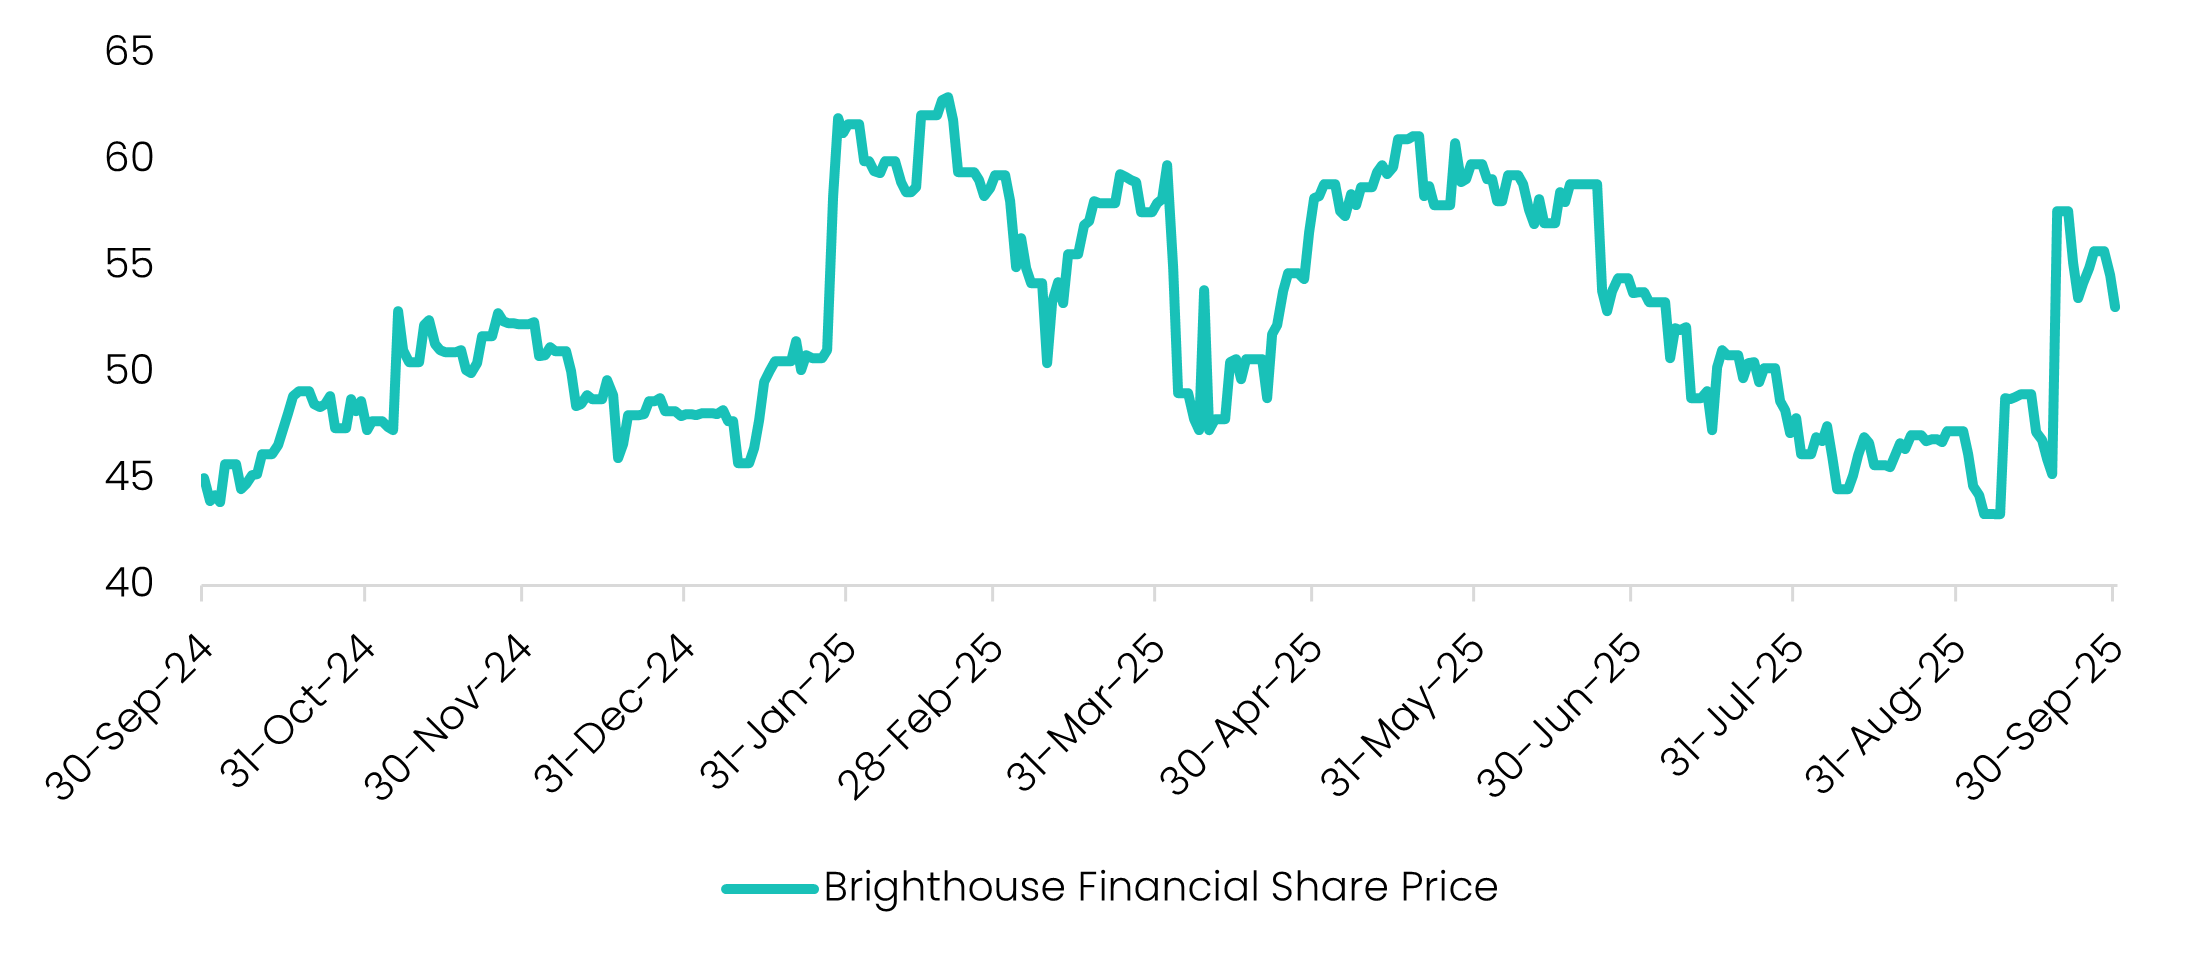
Brighthouse originally put itself up for sale in January this year. Private equities including Apollo Global Management and Carlyle Group are reported to have come and gone in the bidding process. On the 9th of September, Aquarian Holdings were reported to be in advanced talks to acquire Brighthouse “at a significant premium.” On the 22nd of September, a potential offer of US$65-70 per share emerged, representing a whopping 50-60% on the pre-rumour (8-September) valuation. The company is now trading at ~US$55 per share.
For us, Brighthouse represents another quintessential example of our algorithmic strategy in action. Since its spin-off from MetLife, Brighthouse has carried the stigma of an “unwanted” insurance book. Its uneven financial performance has only reinforced that perception, leaving the stock deeply out of favour. Yet while the market has focused narrowly on perceived quality, our algorithms saw an insurer trading at an unjustifiably steep discount to peers, including a price-to-book of 0.44x on insurance assets that – while challenged - are subject to extensive actuarial analysis, modelling and provisioning.
This is where investor psychology often fails. Markets have a habit of reducing companies to absolutes: if a business is seen as “bad quality,” it is dismissed at any price - and vice versa. Our framework resists that binary thinking. Instead, we assess every security on a value-for-money basis, where even unloved names can represent compelling opportunities. In cases like Brighthouse, the market’s inability to price this nuance creates the very inefficiencies that our algorithms are designed to exploit.
Having acquired the stock in early September, Savana is already sitting on a +26% capital gain. Even with the rumoured bid price of US$65-70, the stock still trades at a 20-30% discount to this offer. Looks like the market just isn’t ready to fall in love.
1. The Smart Satellite: how SVNP can complement your core portfolio
2. Savana’s Valuation Radar: how the mega-caps measure up
3. Let it Rain: More M&A in SVNP
Many investors focus on the challenge of picking the “right” individual stocks. Yet, the interaction of those stocks - how they are weighted and correlated – is often overlooked. The allocation of capital across assets not only affects the pattern of returns, but also a portfolio’s ability to withstand different market conditions. In this sense, allocation can be just as important as individual stock selection.
This principle underpins Modern Portfolio Theory (MPT). Our trusty friends at Wikipedia define Modern Portfolio Theory as a “mathematical framework for assembling a portfolio of assets such that the expected return is maximized for a given level of risk.” The intuition behind the mathematics is relatively straightforward; portfolio returns are simply the weighted average returns of the individual stocks, while portfolio risk is a function of both the variance of the individual stocks and crucially, how those stocks are correlated with each other. For all you maths geeks out there, here’s some expressions (assuming you hold two assets, A & B):
Risk-adjusted returns are commonly measured by the Sharpe Ratio, which is the portfolio’s excess return over the risk-free rate, divided by its standard deviation.
This equation goes to the heart of modern portfolio theory: by allocating to securities with low correlation, you can reduce portfolio risk (the denominator of the Sharpe ratio) and boost the overall risk-adjusted return.
Thus, the key lies in correlation! If two investments are not perfectly aligned, their price movements will partially offset each other, smoothing the ride for investors.
- Perfect correlation (1.0): no diversification benefit - both assets move together.
- Low to moderate correlation (0.2–0.7): diversification benefit - one asset’s drawdowns are cushioned by the other.
- Negative correlation (<0): rare in equities, but theoretically the strongest diversifier.
The “sweet spot” for equity portfolios is typically found in that low-to-moderate range, where assets still participate in broad market growth but do so on different terms.
Enter Savana. Our algorithmic, contrarian focus on undervalued US small caps mean we often moves differently from typical core portfolio holdings like the ASX 200 and S&P 500 indices. As capital allocation in the US market broadens out (led by monetary easing and a rebalancing out of top-heavy big tech), we believe that SVNP stands out as being highly accretive in modern portfolio construction.
Let’s test!
The below table sensitizes the Sharpe Ratio of a hypothetical portfolio over the last three months, based on its percentage allocation to the S&P 500 and SVNP. As illustrated in the table, if you allocated 100% of your portfolio capital to the S&P 500, your Sharpe Ratio would be 1.39, whereas if you allocated 100% to SVNP, your Sharpe Ratio would be 1.20. While many investors might simply select the S&P 500 in this instance, the table shows that it is in fact a combination of both securities that yields the highest risk-adjusted return – in this case, 80% in the S&P 500 and 20% in SVNP. The key ingredient? A moderately low correlation of 0.37.
Source: S&P Global, Savana. Calculated on daily returns between 30-Jun-25 to 30-Sep-25. Sharpe ratio is based on 3-month RBA rate.
Modern portfolio theory is, however, not without criticism - in particular, that it evaluates portfolios based on variance rather than downside risk. After all, if your variance is driven by strong gains, you’re probably not feeling overly risky! This brings us to post-modern portfolio theory, which is also a portfolio optimization methodology, but using downside risk rather than mean variance. Instead of using the Sharpe Ratio, risk-adjusted returns are measured by the Sortino Ratio, which simply replaces the standard deviation of returns with the standard deviation of negative returns.
Sortino Ratio
So how does SVNP compare under this revised condition? Adjusting to consider downside risk only, SVNP exhibits a higher Sortino Ratio than the S&P 500 over the three-month period (2.32 versus 2.03), suggesting a superior risk-return profile. Still, it is shown that the Sortino Ratio is maximised by allocating across both securities, with a ~40-50% allocation to SVNP (and a ~50-60% allocation to the S&P 500) yielding an optimised Sortino of 2.65.
Source: S&P Global, Savana. Calculated on daily returns between 30-Jun-25 to 30-Sep-25. Sortino ratio is based on 3-month RBA rate.
It is important to note that, even after adjusting for downside risk, portfolio theory has its limits. It’s inherently backward-looking, and correlations can shift over time. Still, the core message is powerful: the mix matters. That’s exactly where SVNP fits in. In practice, SVNP works best as a satellite allocation alongside established core holdings. By adding exposure to differentiated assets, investors can broaden their opportunity set and build greater resilience into their portfolios.
Savana’s automated valuation engine can evaluate entire markets in a matter of minutes, pinpointing the most undervalued opportunities. Typically, this algorithmic process shines a spotlight on the bottom end of the market — the overlooked, the unloved, the deprived.
But every so often, for a bit of fun, we turn the lens upward. How do the market’s heavyweights stack up when put under Savana’s valuation radar? Which giants look stretched, and which may still offer value? What insights can be drawn? Let’s find out!
Below is a chart mapping the top 20 US-listed companies by market cap. The X-axis represents Savana’s algorithmic valuation probability (further left = greater probability of being undervalued). The Y-axis shows the company’s market capitalisation.
Source: S&P Global, Savana. As of 15-Sep-25.
Here are our three key take-aways:
Microsoft: the standout among the ‘Magnificent Seven’ - While much of the conversation centres on Alphabet’s relatively low P/E ratio, Savana’s algorithm identifies Microsoft as the most attractive opportunity within the Mag-7 cohort. At the other end of the spectrum, Tesla screens as the least compelling on valuation grounds.
Financials come at a premium - Major financial institutions such as JPMorgan, Visa, and Mastercard sit toward the overvalued end of the scale. This suggests investors may be paying a premium for perceived safety, scale, and dominance in payments and banking.
Buffett still has it - Berkshire Hathaway stands out as the most reasonably priced among the mega-caps. How fitting that our digital-age valuation engine tips its hat at one of the great standard-bearers for traditional value investing.
So, that’s the US. But how about our own backyard here in Oz? Here’s what our algorithms tell us:
Source: S&P Global, Savana. As of 15-Sep-25.
The Big Splinter in the ‘Big Four’ – Australia’s largest commercial banks (Commonwealth, NAB, Westpac and ANZ) have historically traded in lockstep. But in recent times, valuations have become dispersed. Commonwealth, recently dubbed the “most expensive bank in the world,” sits clearly at the premium end. ANZ, meanwhile, lags behind as it works through a leadership transition, A$500m+ in restructuring charges, and a recent A$240m ASIC settlement.
Paying a Toll for Stability - Australia’s largest toll-road operator, Transurban, continues to attract a premium valuation thanks to its long-duration concessions, inflation-linked revenues, and near-monopoly assets across major cities. Yet recent results highlight the trade-off: net profit fell over 50% despite revenue growth, as higher finance costs and operating expenses bit into margins. Investors appear willing to pay up for stability - but the stock screens firmly toward the overvalued end of our radar.
QBE Sitting Pretty – Our algorithms flag QBE as one of the most compelling value opportunities among the top 20. In its June quarterly, the insurer posted a 27% uplift in net profit, with volumes, margins, and claims all ahead of expectations. That caps off a stellar three-year run, with revenue up 43% and net profit surging 155%. So why the market discount? Perhaps it reflects broader industry pressures (the first half of this year was the most expensive claims period for global insurers in a decade) with heightened risks from geopolitical tensions, extreme weather events, and escalating cyber threats all weighing on sentiment.
Last month, we discussed the prevalence of M&A events in Savana portfolios. This month, as if to punctuate the point, a further two companies – ODP Corp and Brighthouse Financial – were subject to takeover bids. This brings the total number of corporate action occurrences in SVNP to 8 since inception of the fund in November 2024, representing a 12.7% strike rate based on the number of unique holding (63).
As outlined last month, we believe that our valuation methodology naturally tilts toward attractive M&A targets, providing a powerful lever for capital growth through synergies, value accretion and share price premiums typically realised at sale. ODP and Brighthouse are standout examples…
Source: S&P Global. Up to 30-Sep-25.
ODP, the parent company of Office Depot and OfficeMax, has been navigating a long-term structural decline in the office supplies sector. Its undervaluation, stable cash flows, and sizable retail and distribution presence made it a classic private equity target. In September, Atlas Holdings (a PE company focussed on manufacturing and distribution industries) announced an all-cash acquisition valued at roughly US $1 billion (US $28/share), equating to a 34% premium to ODP’s pre-announcement price. In their announcement, Atlas cited its ability to accelerate ODP’s B2B initiatives and transition from traditional retail as the key value driver of the transaction. The deal underscores how companies that are heavily discounted by public markets often hold significant hidden value that can be extracted under the right shareholder, structure or strategy. By targeting undervalued companies, Savana positions exactly for these kinds of turnaround, asymmetric opportunities.
Source: S&P Global. Financial metrics are Pre-announcement as at 12-Sep-25.
Brighthouse is one of the largest life insurance companies in the US, with balance sheet investment assets of over US $100bn. Originally spun out of global insurance giant, Metlife, in 2017, Brighthouse has been challenged in recent years by stagnant revenue growth and lumpy profitability led by erratic annual claim payouts. Accordingly, the company has long traded at a significant discount to peers.
Source: S&P Global. Financial metrics are Pre-announcement as at 7-Sep-25.
Brighthouse originally put itself up for sale in January this year. Private equities including Apollo Global Management and Carlyle Group are reported to have come and gone in the bidding process. On the 9th of September, Aquarian Holdings were reported to be in advanced talks to acquire Brighthouse “at a significant premium.” On the 22nd of September, a potential offer of US$65-70 per share emerged, representing a whopping 50-60% on the pre-rumour (8-September) valuation. The company is now trading at ~US$55 per share.
For us, Brighthouse represents another quintessential example of our algorithmic strategy in action. Since its spin-off from MetLife, Brighthouse has carried the stigma of an “unwanted” insurance book. Its uneven financial performance has only reinforced that perception, leaving the stock deeply out of favour. Yet while the market has focused narrowly on perceived quality, our algorithms saw an insurer trading at an unjustifiably steep discount to peers, including a price-to-book of 0.44x on insurance assets that – while challenged - are subject to extensive actuarial analysis, modelling and provisioning.
This is where investor psychology often fails. Markets have a habit of reducing companies to absolutes: if a business is seen as “bad quality,” it is dismissed at any price - and vice versa. Our framework resists that binary thinking. Instead, we assess every security on a value-for-money basis, where even unloved names can represent compelling opportunities. In cases like Brighthouse, the market’s inability to price this nuance creates the very inefficiencies that our algorithms are designed to exploit.
Having acquired the stock in early September, Savana is already sitting on a +26% capital gain. Even with the rumoured bid price of US$65-70, the stock still trades at a 20-30% discount to this offer. Looks like the market just isn’t ready to fall in love.
IMPORTANT DISCLAIMER:
This material has been prepared by Savana Asset Management Pty Ltd (ABN 79 662 088 904) (Savana). Savana is a corporate authorised representative of Fat Prophets Pty Ltd (ABN 62 094 448 549 AFS Licence No. 229183) (Fat Prophets), CAR Auth No. 1308949. The Savana US Small Caps Active ETF (ASX: SVNP) (ARSN 649 028 722) is issued by K2 Asset Management Limited (K2) ABN 95 085 445 094, AFS Licence No 244393, a wholly owned subsidiary of K2 Asset Management Holdings Limited (ABN 59 124 636 782). The information contained in this document is produced in good faith and does not constitute any representation or offer by K2, Savana or Fat Prophets.
This material is for information purposes only and has been prepared for both retail and wholesale investors. It is not an offer or a recommendation to invest. No representation is made as to future performance or volatility of the investment, and there is no guarantee that the investment objectives or strategy will be successful. Any forward-looking statements, opinions and estimates are based on assumptions and contingencies which are subject to change without notice. No representations or warranties, expressed or implied, are made as to the accuracy or completeness of the information contained in this document. In preparing this document, we have relied upon and assumed, without independent verification, the accuracy and completeness of all information available to Savana. Persons should rely solely upon their own investigations in respect of the subject matter discussed. To the maximum extent permitted by law, all liability in reliance on this document is expressly disclaimed.
This material may not be reproduced, distributed or published, in whole or in part, without the prior approval of Savana. There are risks associated with an investment in the Savana US Small Caps Active ETF (SVNP), including active management risk, market risk, currency risk, concentration risk, liquidity risk and model risk. Investment values may rise and fall, and past performance is not indicative of future performance.This document has not been prepared taking into account your objectives, financial situation or needs. An investment in SVNP should be considered as part of a broader portfolio, having regard to your individual objectives, financial situation and needs, including your tolerance for risk.
Before making an investment decision, you should consider the Product Disclosure Statement (PDS) and Target Market Determination (TMD), available at www.savana.ai.