It is well-documented that small cap stocks have historically outperformed large cap stocks over the long-run. In the 96-year period between 1927 to 2023, small caps outperformed big caps by an annual average of 2.85%. In the same period, over 10-year investment periods, small caps led two-thirds of the time.
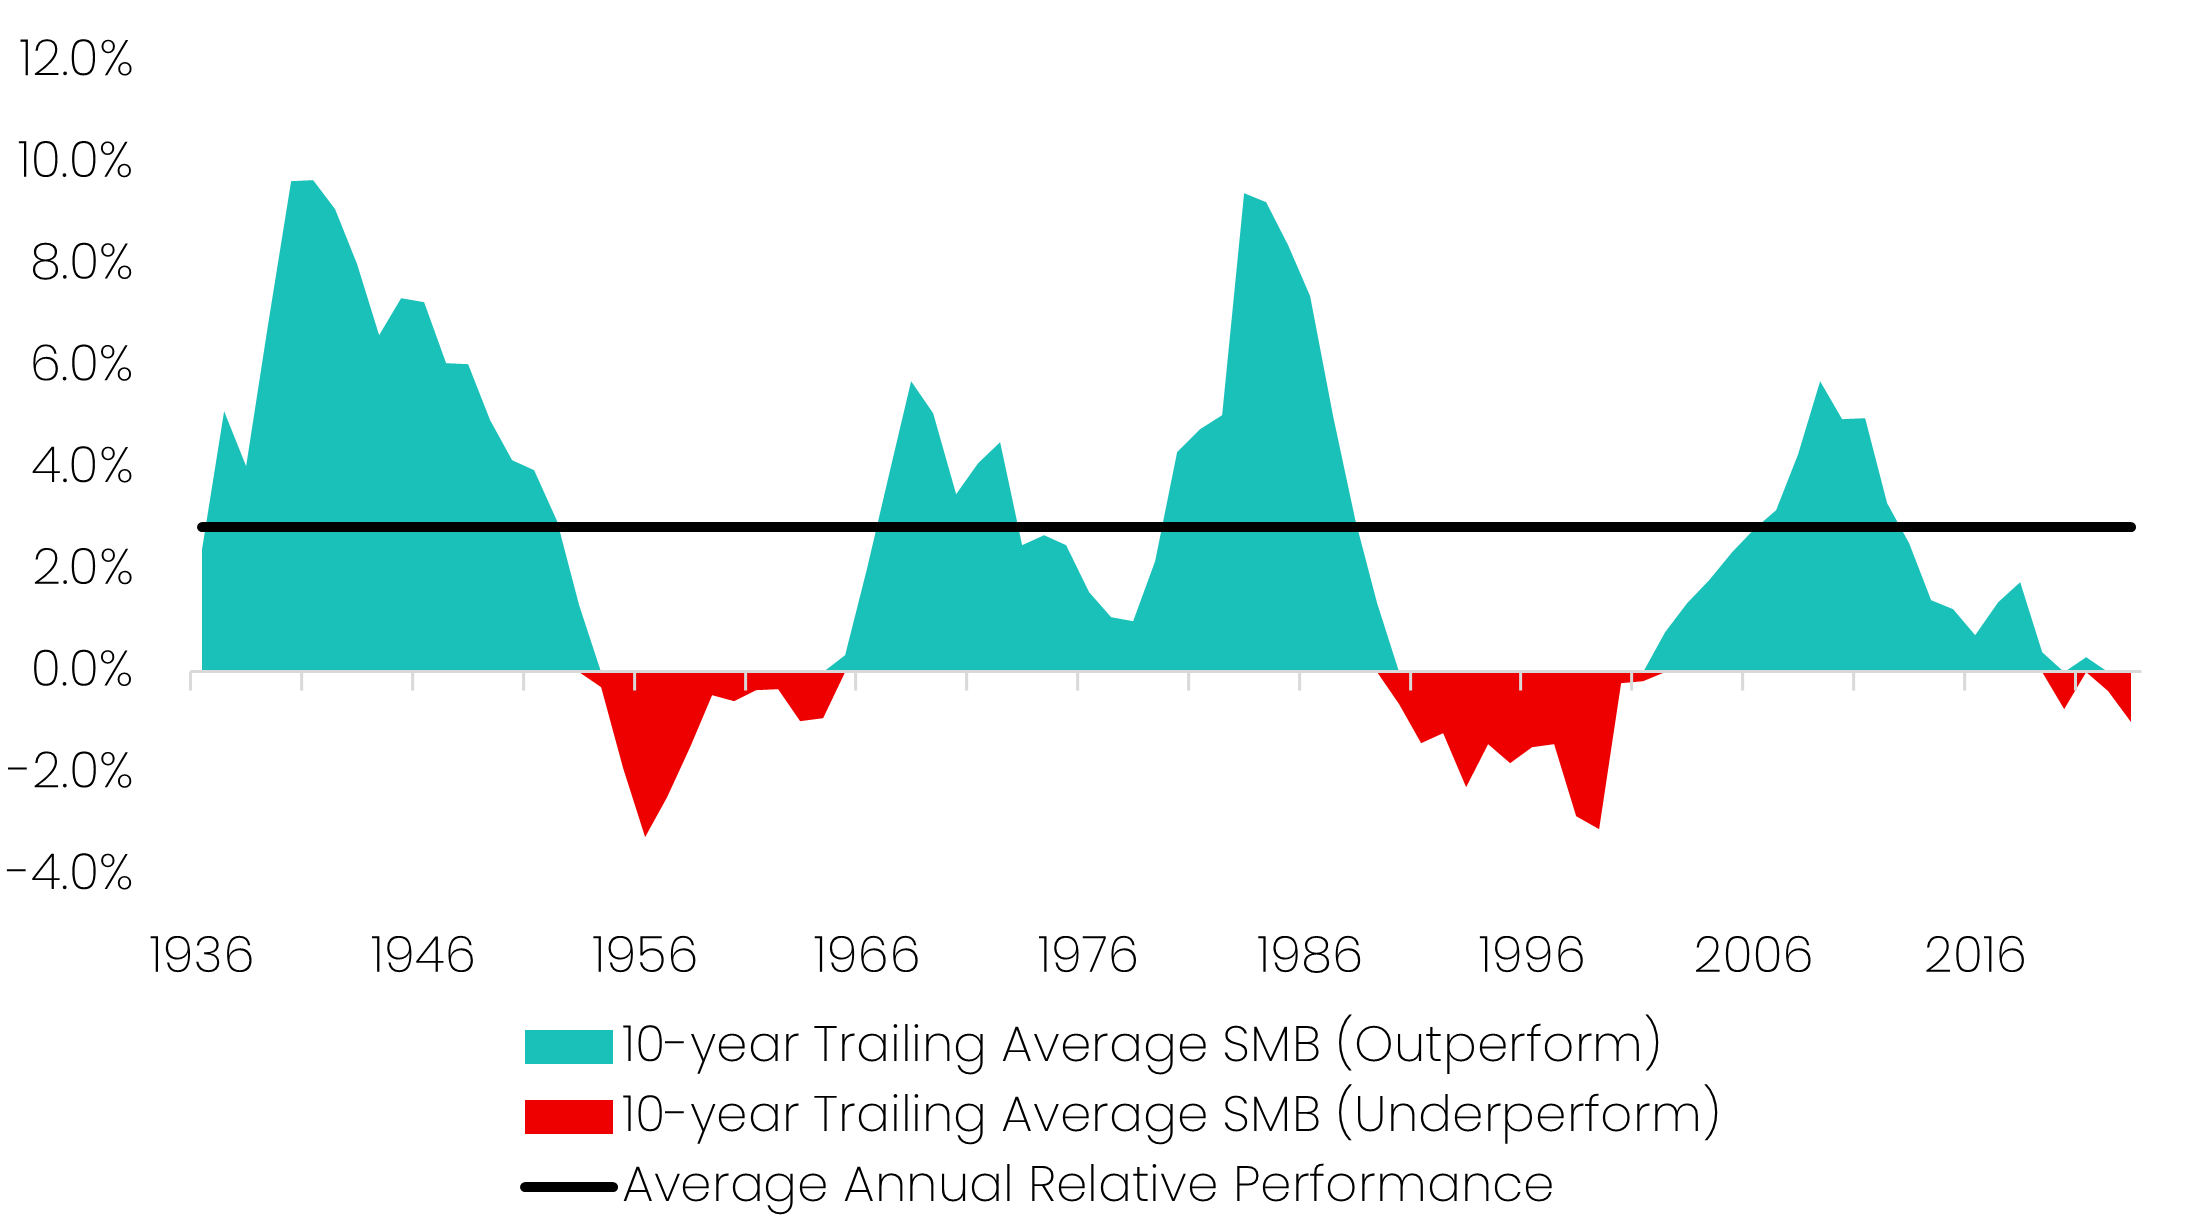
Source: Savana. Original data sourced from Professor Kenneth French Data Library.
But in the past 5 years, a new paradigm has emerged. Mega-cap technology names (including the so-called “Magnificent 7”) have surged on the back of bullish growth predictions and extreme enthusiasm around Artificial Intelligence. These companies, accounting for approximately one third of the S&P 500, have pulled the rest of the index upwards, resulting in an outperformance of small cap indexes.
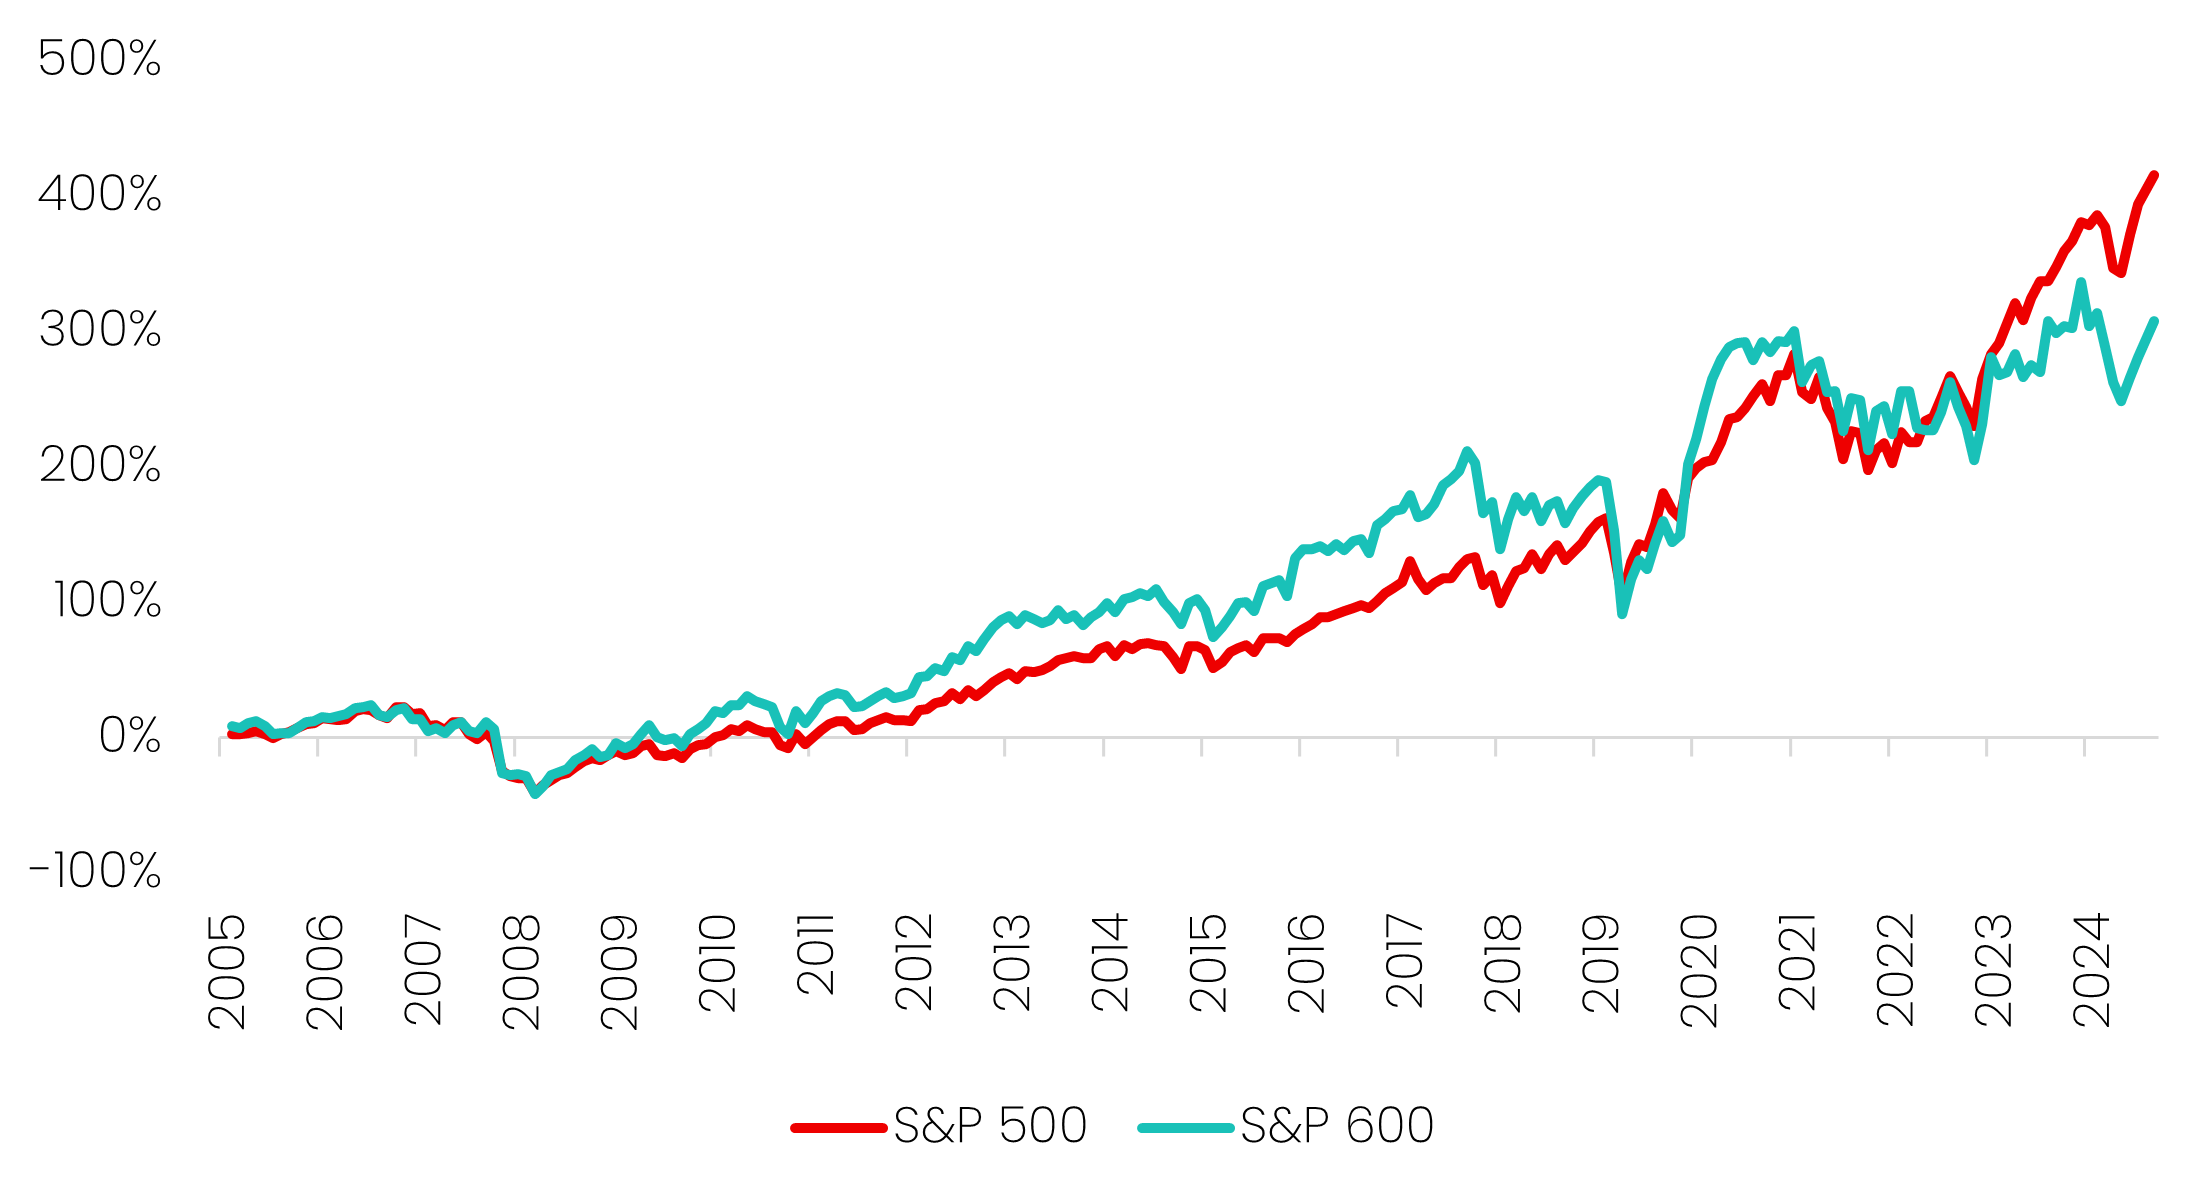
Source: Savana, S&P Global
But as we enter the second half of 2025, we believe that the stars are beginning to align for a long-awaited rotation back to the historical norm. Two forces in particular are setting the stage: a softer monetary policy outlook and fading tech-stock exuberance.
After holding rates steady at 4.25%–4.50% for a fifth consecutive meeting in July (with two dissenting governors marking the first dual dissent since 1993) the Fed now appears to be paving the way for an initial rate cut in September. In his recent speech, Chair Jerome Powell emphasised the need to address both sides of the dual mandate, highlighting the risks to the labour market: “...with policy in restrictive territory, the baseline outlook and the shifting balance of risks may warrant adjusting our policy stance.” Reflecting this shift in tone, markets are now pricing an 85% probability of a September cut, and an 85% probability that rates will fall to 3.50% or lower by December 2026.
Looser monetary policy has historically provided a powerful tailwind for small caps. Unlike their large-cap peers, smaller companies are more sensitive to financing conditions: lower borrowing costs ease balance sheet pressures and unlock growth. As capital becomes cheaper and liquidity looser, small caps tend to re-rate higher.
Markets are already alert to this regime shift. Within the two days following a softer-than-expected CPI print on August 12, the S&P 600 jumped 5.43%, outpacing the S&P 500’s 1.46% gain. Similarly, after Powell’s speech, the S&P 600 rallied 3.80% versus just 1.52% for the S&P 500.
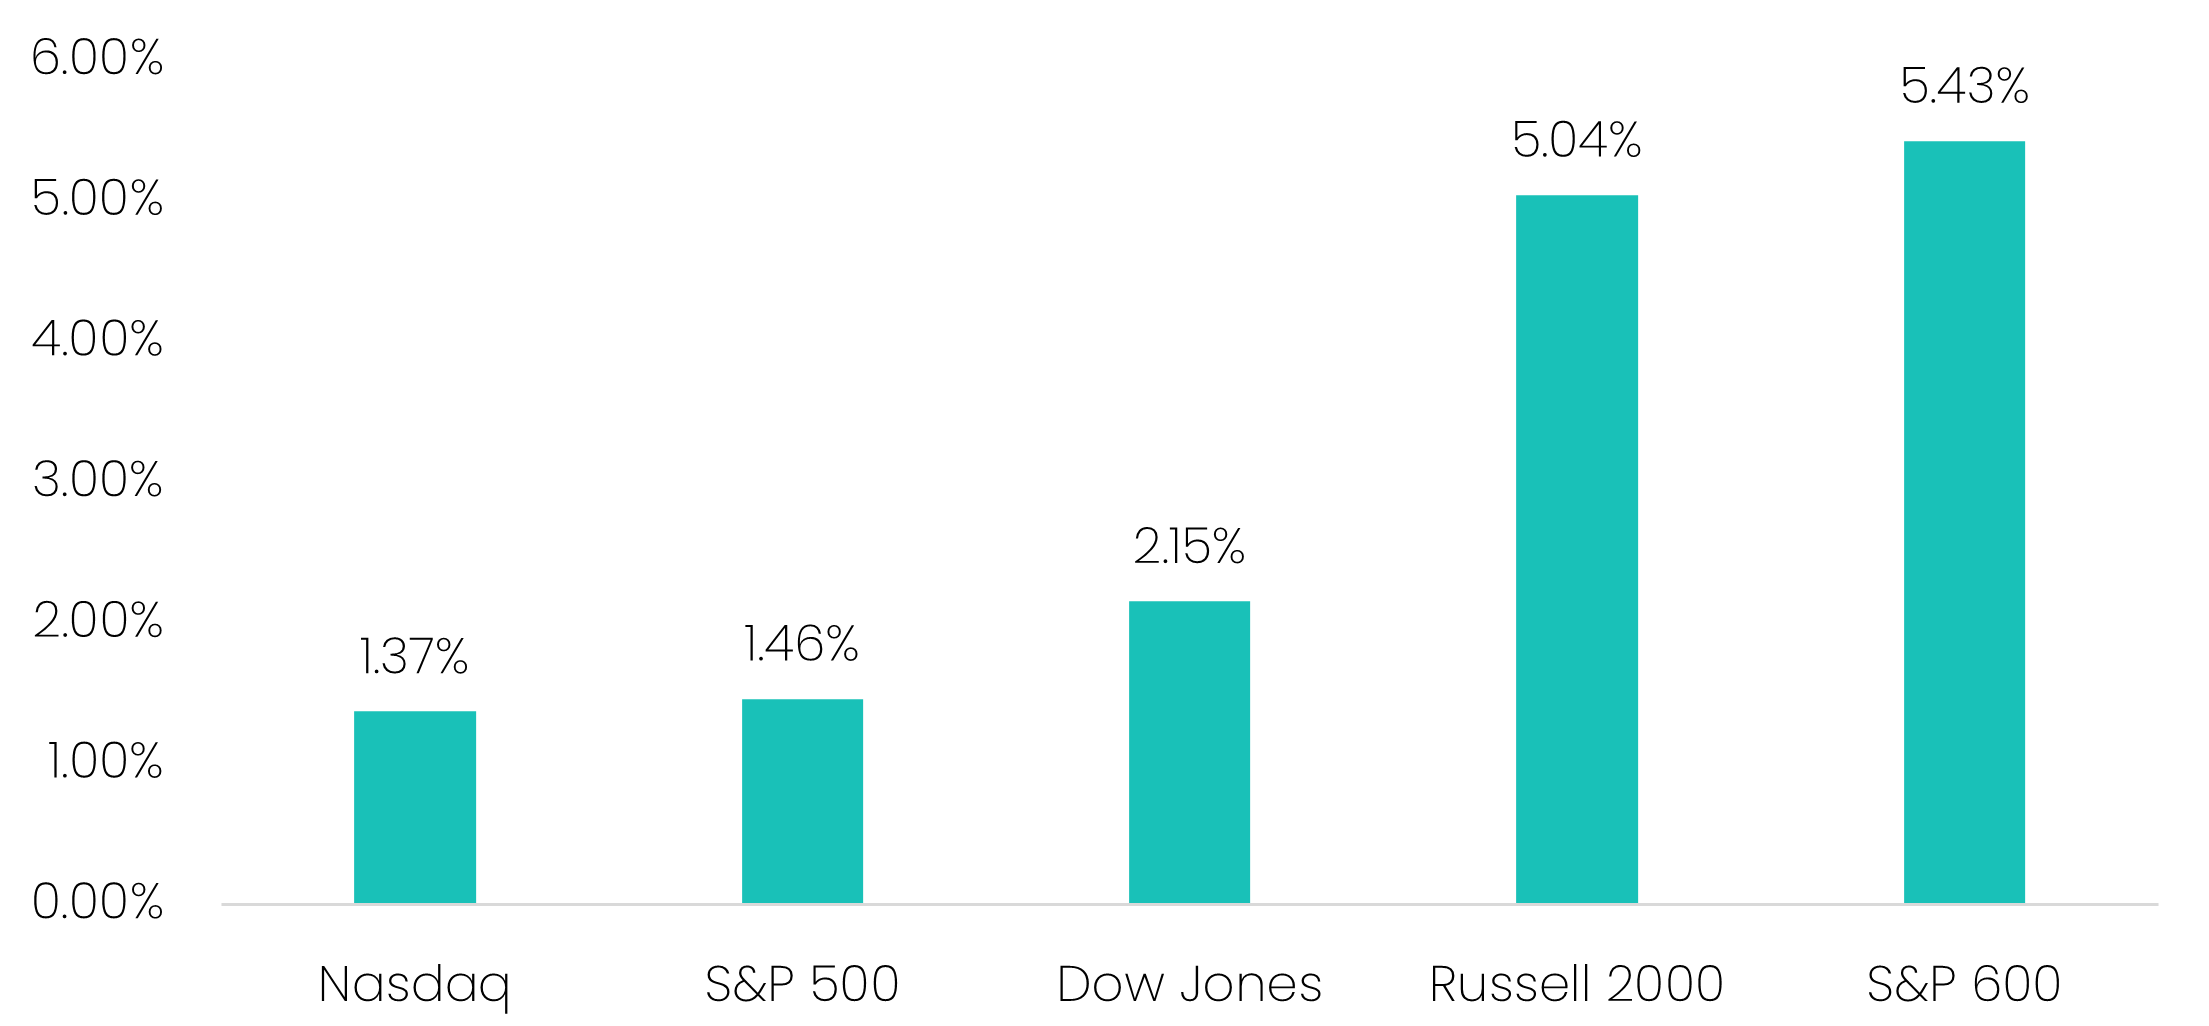
Source: Savana, S&P Global. Performance of major US indices between 12-Aug-25 to 13-Aug-25, following release of the Bureau of Labor Statistics CPI report.
The “AI Trade” and high concentration to the US tech giants has been a terrifically profitable position for investors over recent years. However, this gravy train finally appears to be losing steam.
Year-to-date, Magnificent 7 stocks (equal weighted) have underperformed the broader S&P 500. We see two key reasons for this:
1. Elevated valuations despite slowing EPS growth. On an equal-weighted basis, the Mag-7 still trade on an average P/E ratio of 74.8x, even as forward earnings forecasts have moderated to just 13%. In other words, the “value-for-money” on these names has diminished, leaving little margin for disappointment.
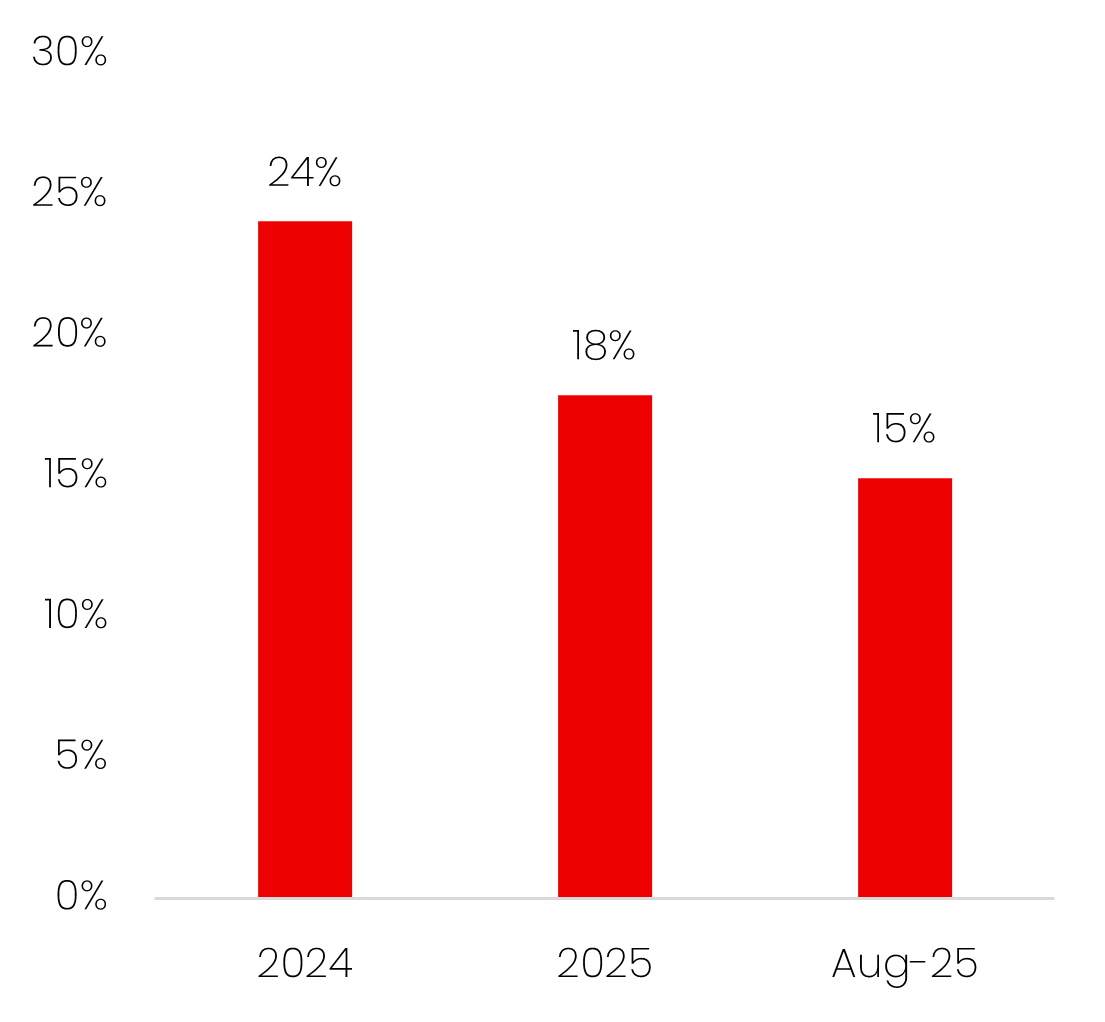
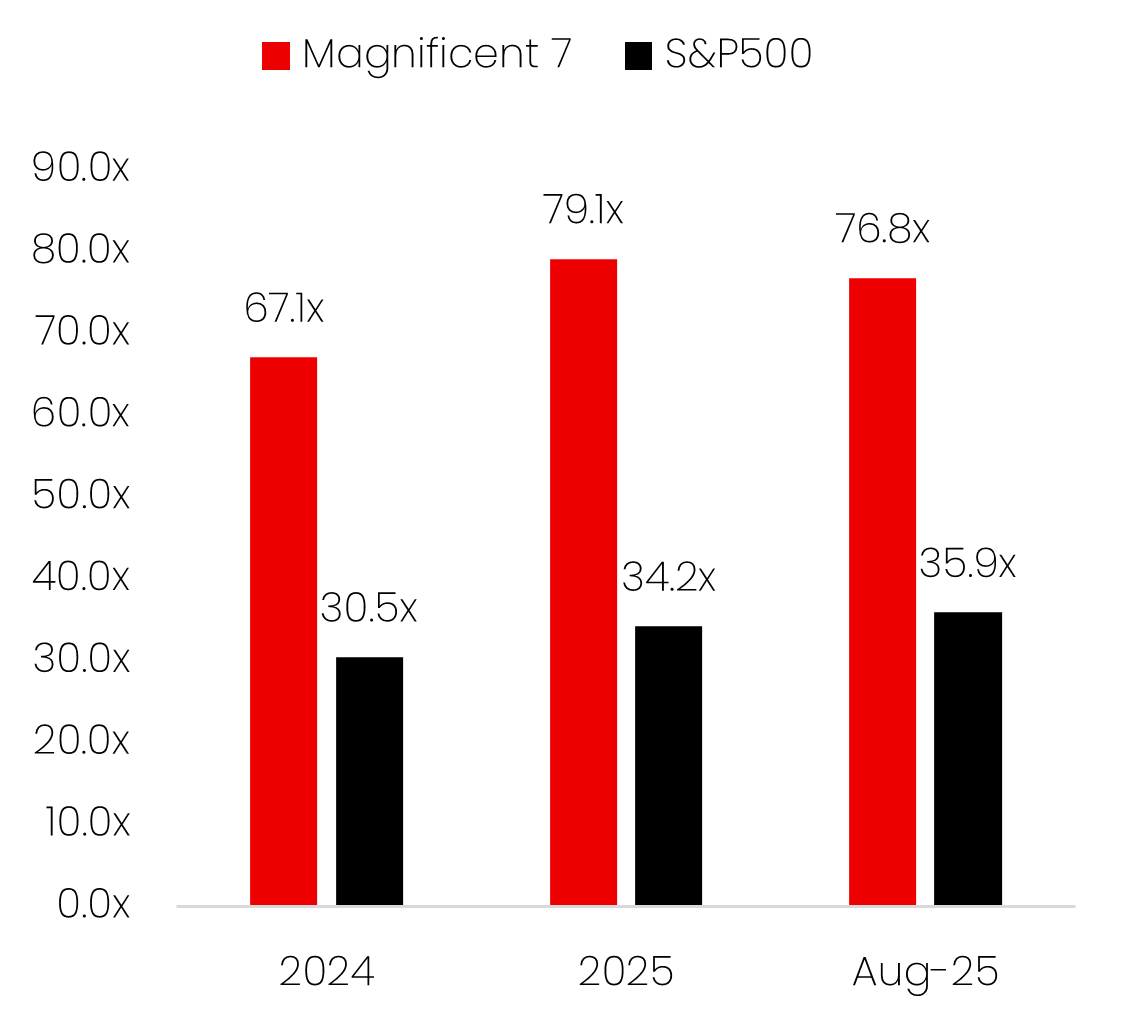
Source: Savana, S&P Global. Mag-7 metrics calculated on an equal-weighted basis.
2. Growing scepticism around AI’s ROI. Momentum has also been dented by doubts over whether massive AI investment is delivering tangible returns. A widely-cited MIT report in July concluded that 95% of organisations are seeing no return on generative AI spend, despite tens of billions of dollars in investment. Sam Altman - arguably AI’s leading voice – has also tempered expectations, recently acknowledging: “Are we in a phase where investors as a whole are overexcited about AI? My opinion is yes.”
Taken together, the shift toward easier monetary policy and the fading of AI-driven mega-cap dominance create a powerful backdrop for small caps. As liquidity returns and investor focus widens beyond large-cap tech, we believe that small caps are well-positioned to re-emerge as a central driver of returns in the cycle ahead.

.png)