
Summary
Savana’s October 2026 investor letter reviews the rebound in US small caps and explains the fund’s weaker performance relative to its benchmark. The commentary focuses on falling US bond yields, a broad market recovery and substantial differences in individual stock returns. It discusses how sharp declines in several holdings outweighed gains elsewhere, and presents portfolio positioning, sector allocations, leading holdings and historical return tables.
The letter also examines the divergence between US and Australian equities and the implications of home bias. Its discussion of active investing considers overlooked information, differences in interpretation and the challenge of acting before a view becomes consensus. Savana explains how algorithms can apply this discipline consistently across a broad investment universe, while emphasising that any investment edge requires empirical evidence and sustained performance in live markets. Portfolio figures relate to the October reporting period, with the accompanying return definitions and investment disclosures applying.
Portfolio Overview
October brought a welcome recovery in US small caps. After a -5.6% decline in September, the S&P Small Cap 600 rebounded +3.2% for the month in USD terms, and +2.0% for the month in AUD. The recovery was broad-based, with 8 out of 11 GICS sectors and 64% of companies in the S&P 600 pushing higher. The relief was largely brought by a 35-basis point retreat in the US 10-Year Treasury Yield – a signal that rates continue to dictate short-term market outcomes.
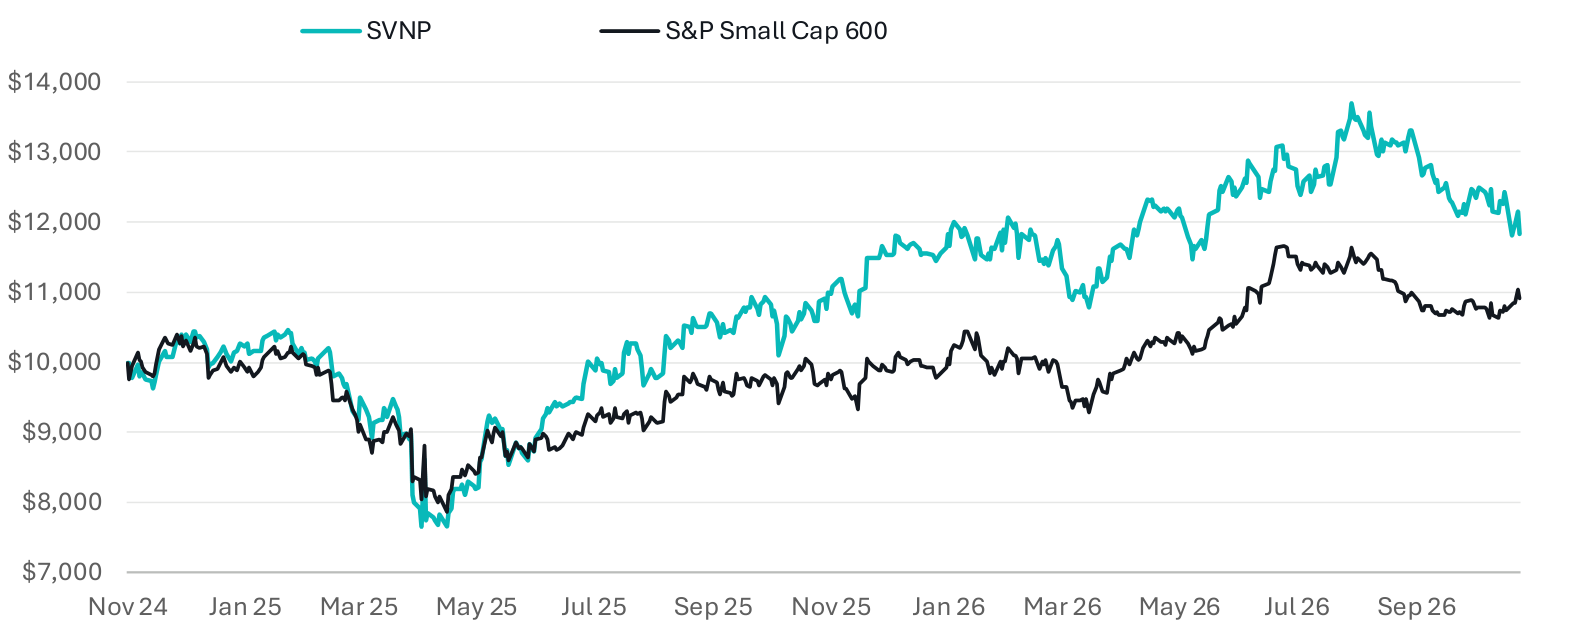
SVNP returned -2.51% for the month, underperforming the S&P Small Cap 600 by -4.54%. The result reflected a meaningful level of dispersion within the portfolio; while the number of positive and negative positions was approximately evenly split, winning positions generated an average return of +12.7%, compared with an average decline of -14.8% among losing positions.
In particular, underperformance was driven by material drawdowns from China Yuchai International Limited (-27.7% return), Terra Innovatum Global N.V. (-34.5%) and Prospect Capital Corporation (-20.8%). Although each company faces its own risks and challenges, the magnitude of these drawdowns was difficult to reconcile with any single development during the month.
On the other side of the ledger, the portfolio benefited from similarly pronounced shifts in sentiment in the opposite direction. Teladoc Health (+46.7%) experienced a sharp re-rating in the lead-up and aftermath of its third-quarter earnings announcement. DXC Technology (+38.3%) rallied following reports of a potential US$2.4 billion sale of its insurance software business, while Kohl’s Corporation (+31.7%) benefited from improving consumer spending data and more positive analyst coverage.
The significant price swings were not isolated to our own portfolio. According to S&P, dispersion in the S&P 500 for October exceeded the 95th percentile of historical readings. Our view is that this is symptomatic of an increasingly fearful investment environment, where sentiment and noise trading are amplifying price movements beyond what the fundamentals suggest. This ‘wall of worry’ is not without justification – the world is confronting a convergence of geopolitical, political, macroeconomic and technological risks, all at once.
While these conditions are challenging, we draw confidence from two key considerations. First, this is precisely the type of environment that a systematic investment strategy is designed to navigate. By maintaining a consistent, unemotional approach to investment decisions, we believe we are well-positioned to identify opportunities created by short-term volatility, while remaining disciplined enough to ride out periods of market turbulence. While the recent drawdowns in the portfolio are uncomfortable, they reinforce the importance of distinguishing between changes in share prices and changes in intrinsic value. Our focus remains on evaluating companies on their underlying merits, rather than recent price movements.
Second, despite the broader uncertainty, we continue to view the US as the most attractive relative investment market, underpinned by its leadership in the global AI revolution and the significant long-term economic opportunities this presents. In particular, the widening divergence between the Australian and US equity markets is becoming increasingly difficult to ignore and, in our view, highlights the relative opportunities available beyond the domestic market. We explore this theme in detail below.
Value of A$10k Since Inception
Trailing & Calendar Year Returns
| Trailing Return* | 1M | 3M | 6M | 1Y | Since Inception |
|---|---|---|---|---|---|
| SVNP | -2.51% | -10.17% | -2.87% | 8.97% | 8.88% |
| Index | 2.03% | -3.32% | 5.25% | 12.38% | 4.45% |
| Relative | -4.54% | -6.85% | -8.13% | -3.41% | 4.43% |
| Calendar Year Return* | 2024 | 2025 | 2026 (YTD) |
|---|---|---|---|
| SVNP | 1.30% | 12.91% | 3.49% |
| Index | -0.74% | -1.57% | 11.58% |
| Relative | 2.04% | 14.48% | -8.09% |
Source: S&P Global, Savana. As of 31 October 2026. The Savana US Small Caps strategy was implemented on the ASX as of the 6th of November 2024. Total returns are calculated in Australian dollars based on the close-of-day net asset value per unit as at the last day of the given period. Returns are after fees and costs with dividends reinvested. Returns for periods greater than one year are annualised. ‘Relative’ figures are the arithmetic difference between the SVNP and benchmark returns shown; the ‘Since Inception’ relative figure is therefore a per-annum differential. Past performance is not indicative of future performance.
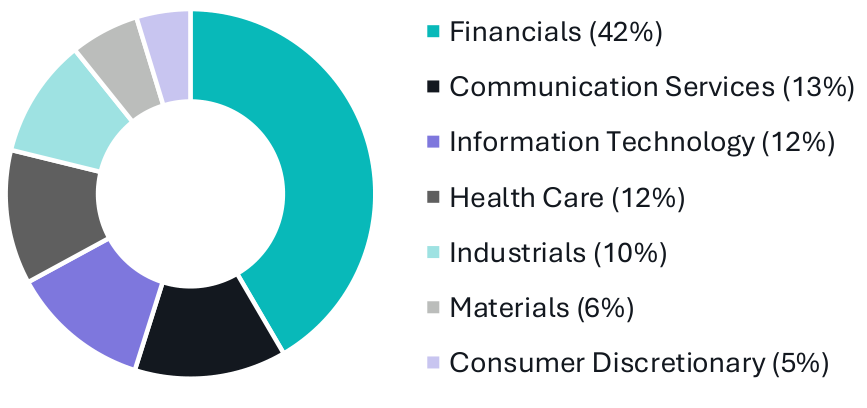
Sector Breakdown
Top 5 Exposures
| Company | Weighting |
|---|---|
| Teladoc Health, Inc. | 5.13% |
| DXC Technology Company | 4.86% |
| Kohl’s Corporation | 4.73% |
| MidCap Financial Investment Corporation | 4.08% |
| Enovis Corporation | 4.06% |
Source: S&P Global, Savana as of 31 October 2026.
The Widening Divide Between Australian and US Equities
The performance gap between Australian and US equities has been apparent for some time. Over the past five years to 31 October 2026, the S&P 500 (AUD) has delivered an annualised total return of 13.5% p.a., compared with 8.0% p.a. for the S&P ASX 200. The divergence has been similarly pronounced among smaller companies, with the S&P SmallCap 600 (AUD) returning 7.6% p.a., compared with just 3.3% p.a. for Australia's Small Ordinaries Index.
Five-Year Cumulative Total Returns (AUD)
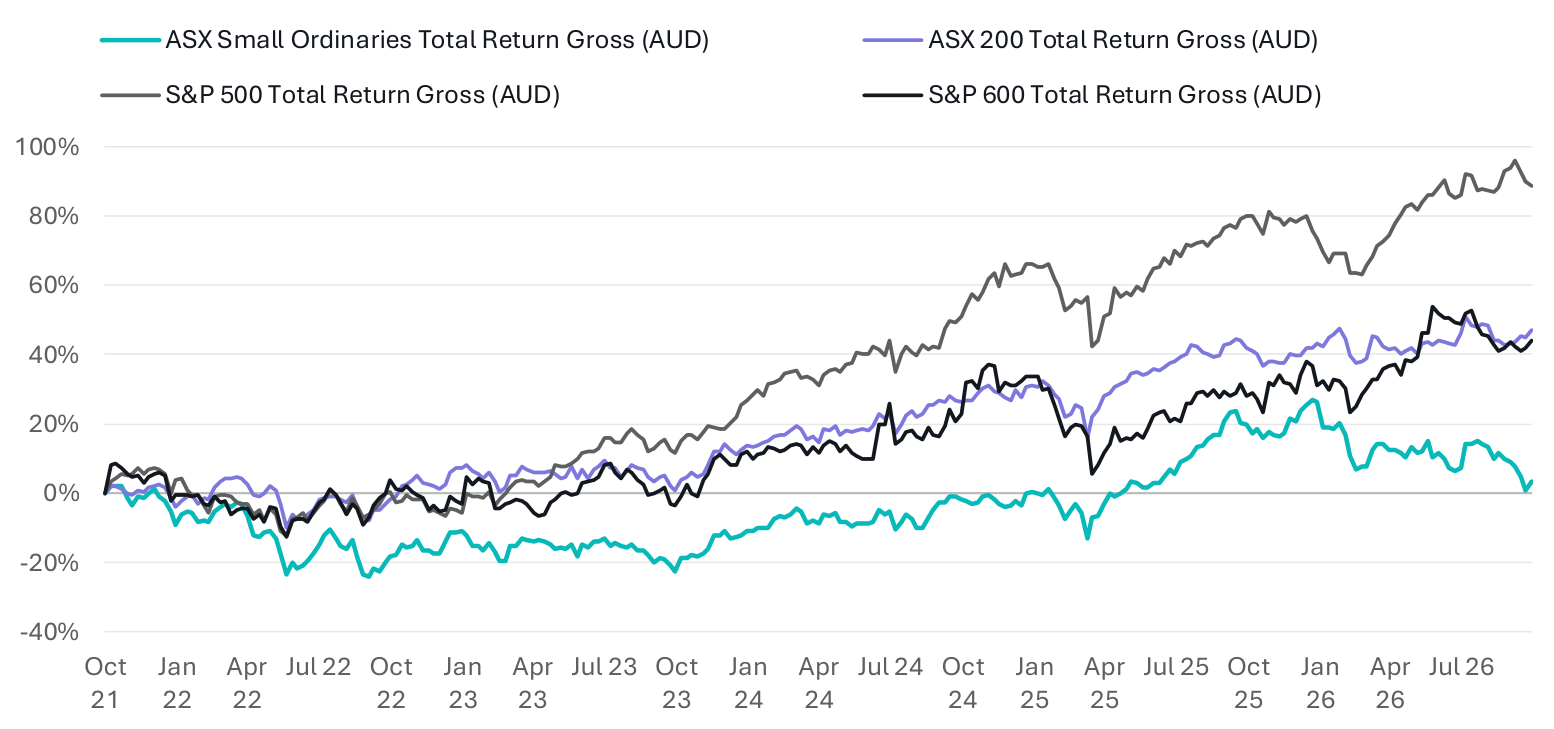
Much of this divergence can be attributed to the extraordinary growth of the US technology giants, whose increasing dominance of major equity indices has been a significant driver of market performance.
Technology companies now account for approximately 40% of the S&P 500, compared with just 2% of the ASX 200, where financials and materials collectively represent almost 60% of market capitalisation. The US market has consequently been a major beneficiary of the exceptional earnings growth and valuation expansion of its largest technology companies. Indeed, S&P Dow Jones Indices estimates that the Magnificent Seven accounted for approximately 55% of the S&P 500's total return between 2023 and 2025. By contrast, Australia's equity market remains substantially more exposed to domestic credit conditions, the housing market and global commodity cycles.
Looking ahead, we see compelling reasons to expect this divergence to widen further. In our view, what has largely been a divergence in market composition is increasingly becoming a divergence in underlying economic potential.
The US's position at the centre of the global innovation and investment cycle, its superior productivity performance and the relative strength of its economy are creating structural advantages that we believe will become increasingly evident in equity market outcomes.
The most obvious manifestation of this advantage is the extraordinary scale of capital being deployed into AI. J.P. Morgan estimates that major US technology companies are on track to spend almost US$800 billion on capital expenditure in 2026, approximately ten times their spending in 2019.
This investment is already making a meaningful contribution to US economic growth. Federal Reserve data indicates that a broad basket of AI-related investment categories contributed approximately 1.4 percentage points to annualised US GDP growth in the March quarter.
As the global centre of innovation and capital formation, the US benefits from a powerful reinforcing relationship between innovation, investment and wealth creation. Underpinning this is a vast, diversified and comparatively self-reliant economy. Domestic consumption accounts for approximately 68% of US GDP, while international trade represents just 25%, compared with 46% in Australia. The US has also been a net energy exporter since 2019, providing an additional source of economic resilience.
Combined with its deep capital markets, this creates an environment in which innovative companies can attract investment, scale rapidly and reinvest in further growth. Indeed, the OECD estimates that 75% of global AI venture capital investment flowed into US companies in 2025.
By contrast, Australia's economy remains more exposed to a narrower range of industries and external markets, with resources accounting for almost 59% of exports and China representing 29% of export destinations. The domestic economy is also increasingly reliant on low-productivity, labour-intensive services, while its listed equity universe has contracted by almost 12% over the past five years.
These structural differences are beginning to manifest into economic outcomes. Since March 2024, US labour productivity has increased by 5.3%, while Australian productivity has declined. This is contributing to systemically higher growth, lower unemployment and lower inflation all at once. The US economy expanded at an annualised rate of 3.4% in the September quarter, while the IMF's October forecasts project growth of 2.3% in both 2026 and 2027. By comparison, Australian growth is forecast at 1.9% and 1.6%, respectively.
Australia vs US: Key Economic Indicators
| % year-on-year unless stated | Jun 25 | Sep 25 | Dec 25 | Mar 26 | Jun 26 | Sep 26 |
|---|---|---|---|---|---|---|
| Real GDP growth — Australia | 3.2% | 2.0% | 3.6% | 1.2% | 1.6% | – |
| Real GDP growth — United States | 4.0% | 3.9% | 0.2% | 2.5% | 2.2% | 3.4% |
| Labour productivity growth — Australia | 0.2% | 1.2% | 1.1% | 0.2% | -0.2% | – |
| Labour productivity growth — United States | 2.1% | 2.5% | 2.5% | 2.9% | 2.2% | – |
| Unemployment rate (%) — Australia | 4.3% | 4.4% | 4.1% | 4.3% | 4.5% | 4.7% |
| Unemployment rate (%) — United States | 4.1% | 4.4% | 4.4% | 4.3% | 4.2% | 4.2% |
| Headline CPI inflation — Australia | 2.1% | 3.2% | 3.6% | 4.1% | 3.9% | 3.9% |
| Headline CPI inflation — United States | 2.7% | 3.0% | 2.7% | 3.3% | 3.5% | 3.7% |
Source: S&P Global, Savana; ABS, Australian National Accounts (June 2026); BEA, Real GDP (October 2026 release). Quarter-end readings. Real GDP growth is quarter-on-quarter growth expressed as a seasonally adjusted annualised rate. Labour productivity is the year-on-year change in quarterly productivity indices (US: nonfarm business; Australia: economy-wide), so the two measures differ in coverage. CPI is headline inflation (Australia: quarterly; US: monthly, quarter-end month). ‘–’ denotes data not yet released. Data to 31 October 2026.
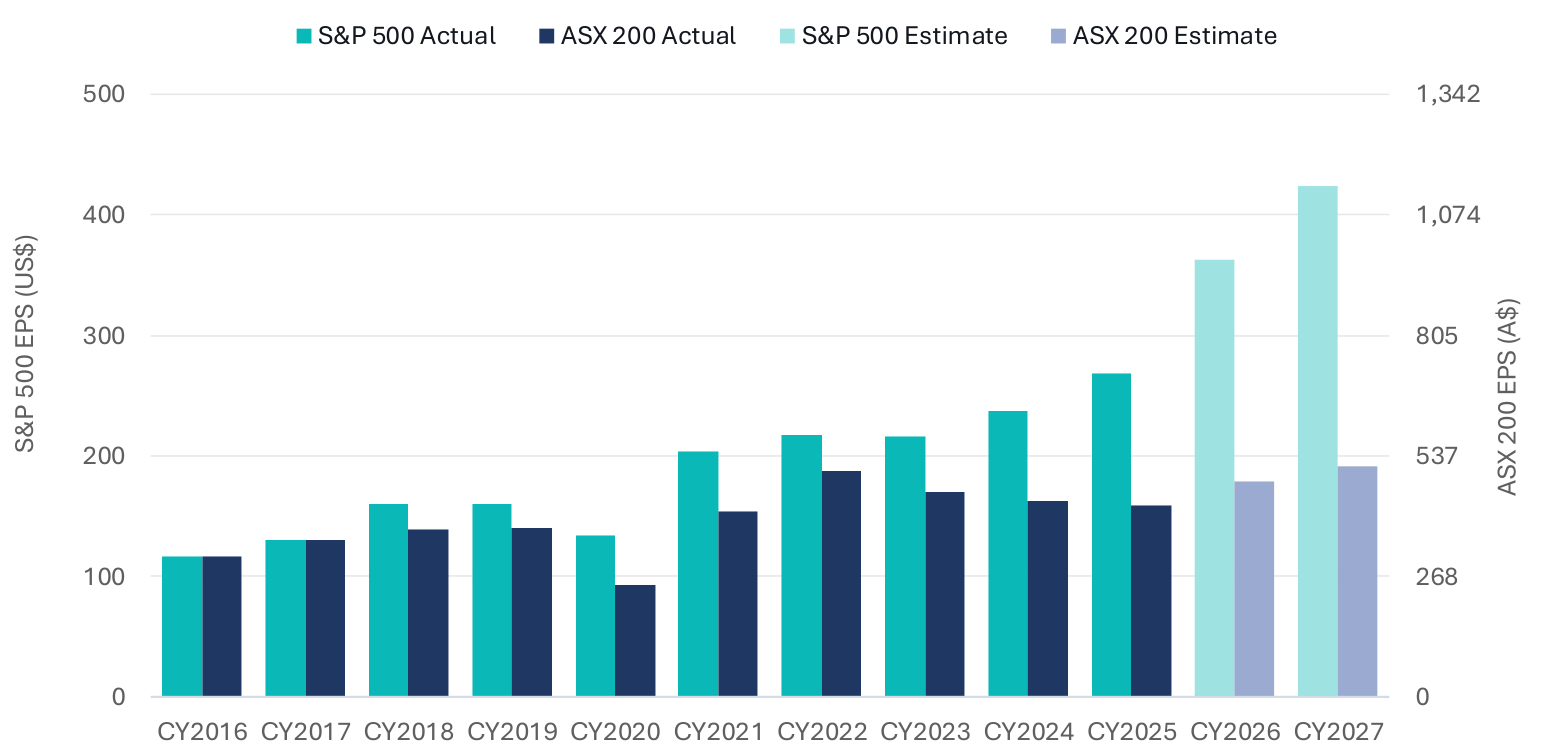
Ultimately, these structural advantages are increasingly evident in the outlook for corporate earnings. Consensus estimates point to S&P 500 earnings per share growing by 35% in CY26, with the S&P SmallCap 600 expected to grow by 31%. By comparison, after two consecutive years of declining earnings, the S&P ASX 200 is forecast to deliver earnings growth of 12.7% in 2026 and 7.0% in 2027. For smaller Australian companies, the outlook is weaker still, with consensus forecasts for the Small Ordinaries implying cumulative earnings growth of less than 9% across 2026 and 2027 combined.
Over the long term, equity market returns are ultimately driven by corporate earnings - and the gap in earnings growth between US and Australian companies is widening.
Annual Earnings Per Share: S&P 500 vs S&P ASX 200
In our view, global equities are entering a particularly risk-sensitive period, and the US is by no means immune. Persistent inflation, elevated interest rates and high public debt are challenges shared by most developed economies. What distinguishes the US, however, is its capacity to grow through these challenges. The powerful AI investment cycle, superior productivity growth and a diversified, comparatively self-sufficient economy underpin what we see as a compelling relative investment opportunity.
In our view, for Australian investors, facing stagnant productivity and a narrower domestic growth base, the case for US equities extends well beyond geographical diversification. We believe the US is the economy best equipped to translate the next wave of global innovation into sustained earnings growth and long-term wealth creation.
“Using Algorithms to Achieve Active ETF Performance”
Earlier this month, the Savana team presented at the ETF Evolution 2026 Summit in Sydney.
One theme that came up repeatedly throughout the conference was the age-old debate between active and passive investing. One well-known statistic was frequently cited: that according to S&P data, 89% of Australian Equity General funds underperformed their benchmark over the past 15 years.
It's a sobering statistic for an active manager, and one that raises important questions. Firstly, is consistent, long-term outperformance actually viable? And if so, how can it be achieved?
Coincidentally, this was the focus of our presentation at that very conference, Using Algorithms to Achieve Active ETF Performance, where we explored the academic research behind market inefficiencies, how algorithms can be used to exploit them, and what the evidence tells us about the potential for repeatable, long-term outperformance.
For those who missed it, here are some of the key takeaways.
First, Why Are Markets So Difficult to Beat?
Our starting point is that financial markets are, for the most part, very efficient. At any given moment, millions of investors are analysing companies, interpreting financial information and making investment decisions. Each investor brings different knowledge, experience and perspectives to the market, and while their individual assessments are far from perfect, their collective judgement can be remarkably accurate.
This is the principle of Collective Intelligence, or the wisdom of crowds. As investors collectively process new information, share prices tend to adjust towards their underlying intrinsic values. The result is a highly competitive environment in which opportunities to buy genuinely undervalued companies are difficult to identify.
So, how can an investor reasonably expect to outperform in such an environment?
In our view, the key is to identify those occasions when the wisdom of crowds breaks down – when the diversity of independent perspectives gives way to herding and groupthink. As investors increasingly think and behave alike, their errors can become correlated rather than cancelling one another out, creating temporary but meaningful divergences between market prices and underlying value.
Therefore, capturing these opportunities relies on the ability to both think and act differently from the crowd. In our view, this involves four essential elements, as outlined below.
1. Find Information That Others Have Overlooked
The most obvious way to gain an investment advantage is to possess information that other investors don't have. Hedge funds are particularly well-versed in this; using ‘alternative data’ such as satellite imagery, credit card data and expert networks to possess an information edge that other investors don’t have access to.
But there's another, often overlooked possibility: the information is already publicly available, but relatively few investors are paying attention to it.
An interesting example of this occurred in 1998, when The New York Times published a front-page story about a potential breakthrough in cancer treatment involving a biotechnology company called EntreMed.
The following trading day, EntreMed's share price surged from approximately $12 to nearly $52. The interesting part? The same scientific findings had already been published more than five months earlier, including in The New York Times itself.
Another more recent example was provided in a 2024 study published in The Journal of Finance, which examined how the placement of financial news on Bloomberg terminals influenced investor behaviour. The researchers found that articles appearing prominently on the terminal generated 240% more trading volume and 176% larger immediate price reactions than equally important articles receiving less prominent placement.
In both examples, the information itself did not change. What changed was the way it was presented and the attention it received. For active investors, the implication is clear: there can be value in identifying relevant information before the rest of the market.
2. Interpret the Same Information Differently
Alternatively, an investor can gain a contrarian edge by having access to the same information as everyone else, but interpreting its implications differently.
Consider a company that has just reported disappointing earnings. One investor might interpret the result as evidence of a prolonged deterioration in performance. Another might view it as a temporary setback, with relatively little impact on the company's long-term value.
Both investors have the same information, yet their assessments of intrinsic value could be dramatically different.
We saw a recent example of this with Everforth, a US IT services company whose share price fell more than 50% in a single day following disappointing quarterly earnings. Our algorithms subsequently identified the company as significantly undervalued, and when earnings recovered the following quarter, its share price rebounded by more than 50%.
Everforth Share Price (US$)
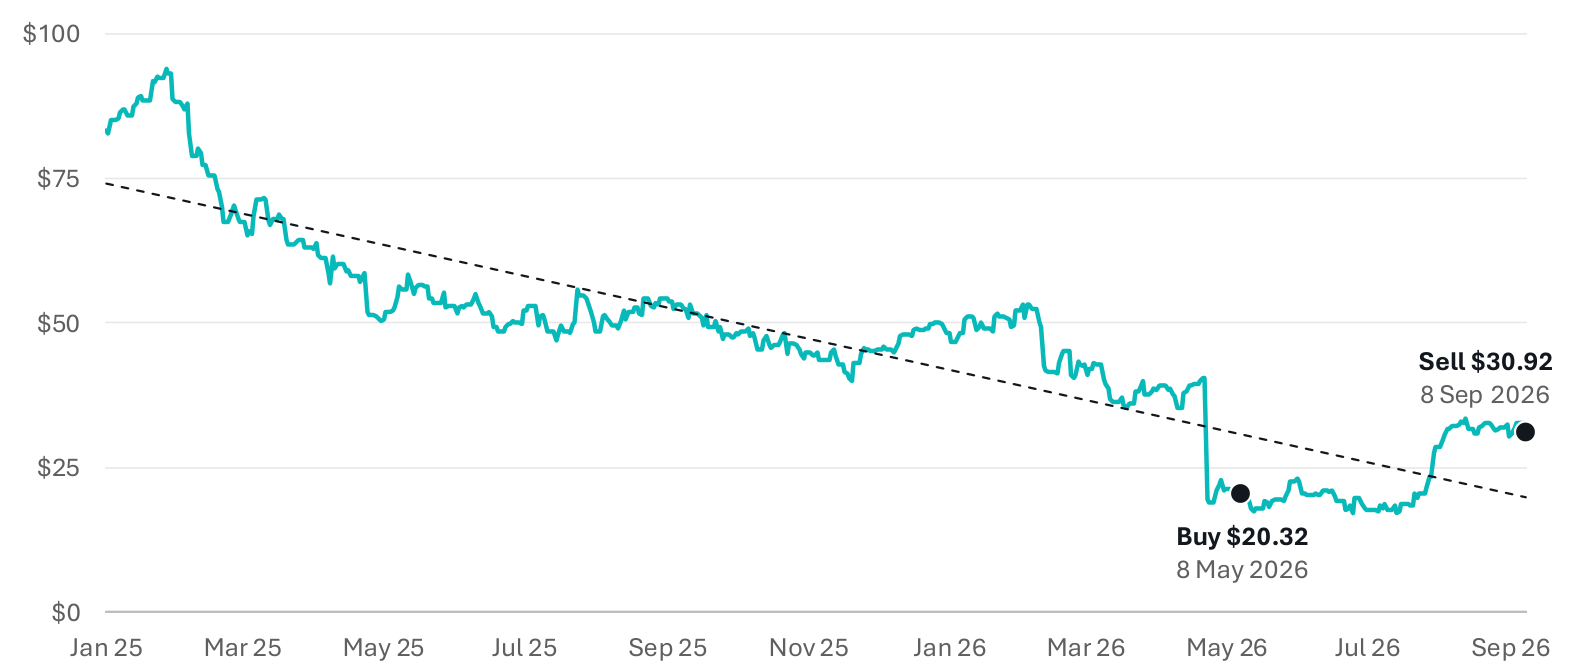
The example illustrates a well-documented behavioural tendency: investors frequently extrapolate recent experience too far into the future, becoming excessively optimistic about companies performing well and overly pessimistic about those experiencing difficulties.
For active investors, the opportunity lies in recognising when these expectations have become disconnected from underlying fundamentals. The challenge isn't simply to reach a different conclusion from the market, but to reach a more accurate one.
3. Be Willing to Move Before the Market Agrees
Having a differentiated view is one thing. Acting on it is another. And this is where investing becomes particularly difficult.
If you believe the market has significantly undervalued a company, there's a reasonable chance that most other investors disagree with you. That might mean buying a company following a disappointing earnings announcement, investing in an unpopular sector, or catching what appears to be a falling knife. None of these decisions are particularly comfortable.
In fact, the more compelling the valuation opportunity, the more uncomfortable the investment decision can sometimes feel. But there's an important point here: if you wait for the rest of the market to agree with your assessment, there's a good chance the opportunity will already have disappeared. Once the consensus shifts and investors begin recognising the same underlying value, the share price will generally have adjusted accordingly.
Of course, going against the crowd is not an investment strategy in itself. Sometimes the market is pessimistic for very good reasons. The objective is to identify when expectations have become excessively optimistic or pessimistic relative to the fundamentals, and to have the conviction to act before those expectations correct.
4. Develop a System That Can Do This Consistently
Even if an investor can identify overlooked information, interpret it correctly and act before the broader market, there's still one final challenge. Can they repeat that process consistently?
This is where we believe algorithms have a particularly compelling advantage.
Human investors are naturally influenced by emotions, recent experiences and prevailing market narratives. Even the most experienced investment professionals can find it difficult to act objectively when markets are moving sharply against them.
Algorithms, by contrast, can apply the same investment principles consistently, without fear, greed or the temptation to follow the crowd.
They also have an enormous advantage in breadth. While a fundamental analyst might spend weeks researching a handful of businesses, algorithms can systematically assess thousands of companies, identifying potential opportunities as they emerge across the broader market.
Importantly, this doesn't require every investment decision to be correct. If an algorithm can identify even a relatively small statistical advantage, applying that edge consistently across a diversified portfolio and over many investment decisions can produce meaningful results over time.
In many ways, this is the central attraction of systematic investing: the ability to turn a modest investment edge into a repeatable process.
Putting It Together
The persistent underperformance of active managers is a reminder of just how competitive financial markets have become. But it doesn't mean that opportunities for outperformance don't exist.
In our view, the challenge is to identify information or insights that the broader market has yet to fully appreciate, have the conviction to act before those insights become consensus, and develop a process capable of repeating that discipline over time.
Algorithms offer a compelling way to bring these elements together, combining the breadth and consistency of systematic analysis with investment principles grounded in fundamental valuation and behavioural finance.
Of course, a compelling theory is not enough. Any genuine investment edge must ultimately be supported by robust empirical evidence and, most importantly, sustained performance in live markets. That takes time. But we believe it is precisely this combination of sound economic reasoning, disciplined implementation and long-term validation that offers the best prospect of overcoming the difficult odds facing active managers.