While most Australian investors gain US equity exposure through large-cap indices such as the S&P 500 and Nasdaq 100, we believe that this approach overlooks one of the most dynamic and under-appreciated segments in global markets.
Operating closer to the domestic US economy and typically exhibiting more dynamic growth characteristics, US Small Caps have historically delivered strong long-term outperformance while offering meaningful portfolio diversification benefits relative to large caps.
The Savana US Small Caps Active ETF (ASX: SVNP) was established to broaden access to US Small Caps for Australian investors, combining targeted exposure with an active, algorithm-driven stock selection process designed to capitalise on the inefficiencies inherent in small-cap markets.
SVNP is benchmarked against the S&P Small Cap 600, a market capitalisation-weighted index of US companies with market caps between $1.2 billion and $8 billion, selected in part on demonstrated profitability - a quality screen that distinguishes it from broader small-cap benchmarks like the Russell 2000.
Here’s a closer look at why US Small Caps make a compelling case for inclusion in any well-diversified equity portfolio.
While recent market narratives have focused on large-cap performance, a longer-term perspective demonstrates that US Small Caps have in fact generated the most compelling long-term returns across market cycles. Over the last 25 years, the S&P Small Cap 600 has returned 9.27% per annum, exceeding the S&P 500 (8.83% p.a.), the ASX 200 (8.48% p.a.) and other major indices.1
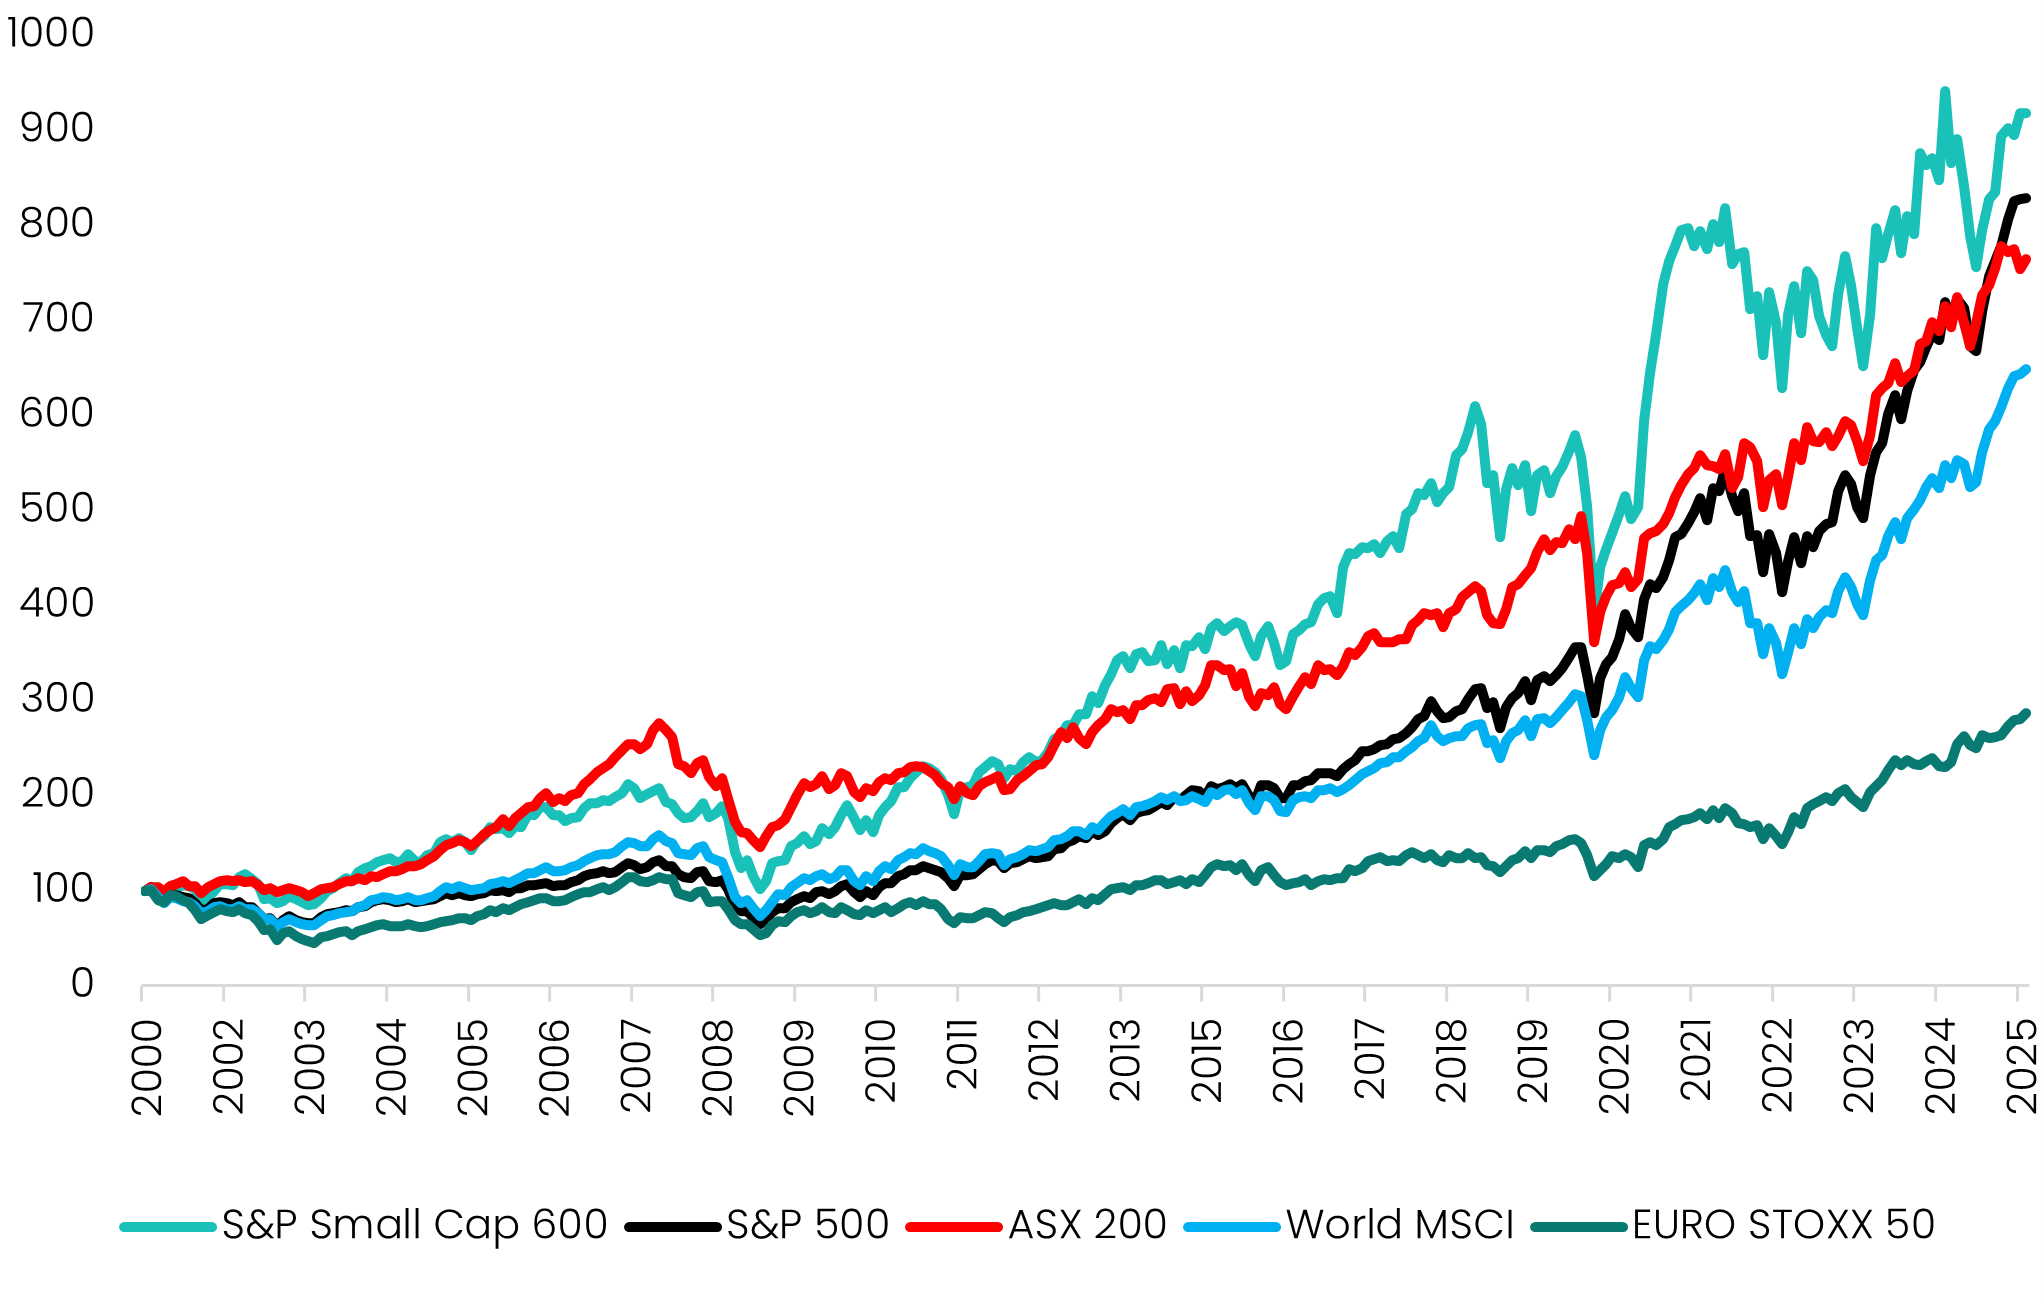
Source: S&P Global, Savana. Gross total return index performance, based on local currency, between 1 January 2001 to 31 December 2025.
This 25-year performance profile is consistent with the well-established empirical characteristics of small-cap equities. By their nature, smaller companies tend to exhibit greater sensitivity to economic cycles. This was evident during the Global Financial Crisis, where the S&P Small Cap 600 lagged the S&P 500 from 2006 to 2009, before materially outperforming throughout the ultra-low-interest rate environment that defined much of the 2010–2020 period. This heightened sensitivity translates into higher volatility, with small caps typically exhibiting a greater standard deviation of returns and, in turn, elevating the overall risk-return profile of a portfolio.
However, small caps are not just about taking on more market risk. Their return premium is supported by a range of structural drivers inherent to small caps - including earlier-stage expansion opportunities and a deeper pipeline of corporate catalysts such as M&A activity and operational turnarounds - which broaden the opportunity set for outsized returns. These attributes are reflected in stronger underlying earnings dynamics over time, with the S&P Small Cap 600 delivering average three-year normalised net income growth of 8.08% over the past two decades, compared to 5.87% for the S&P 500.
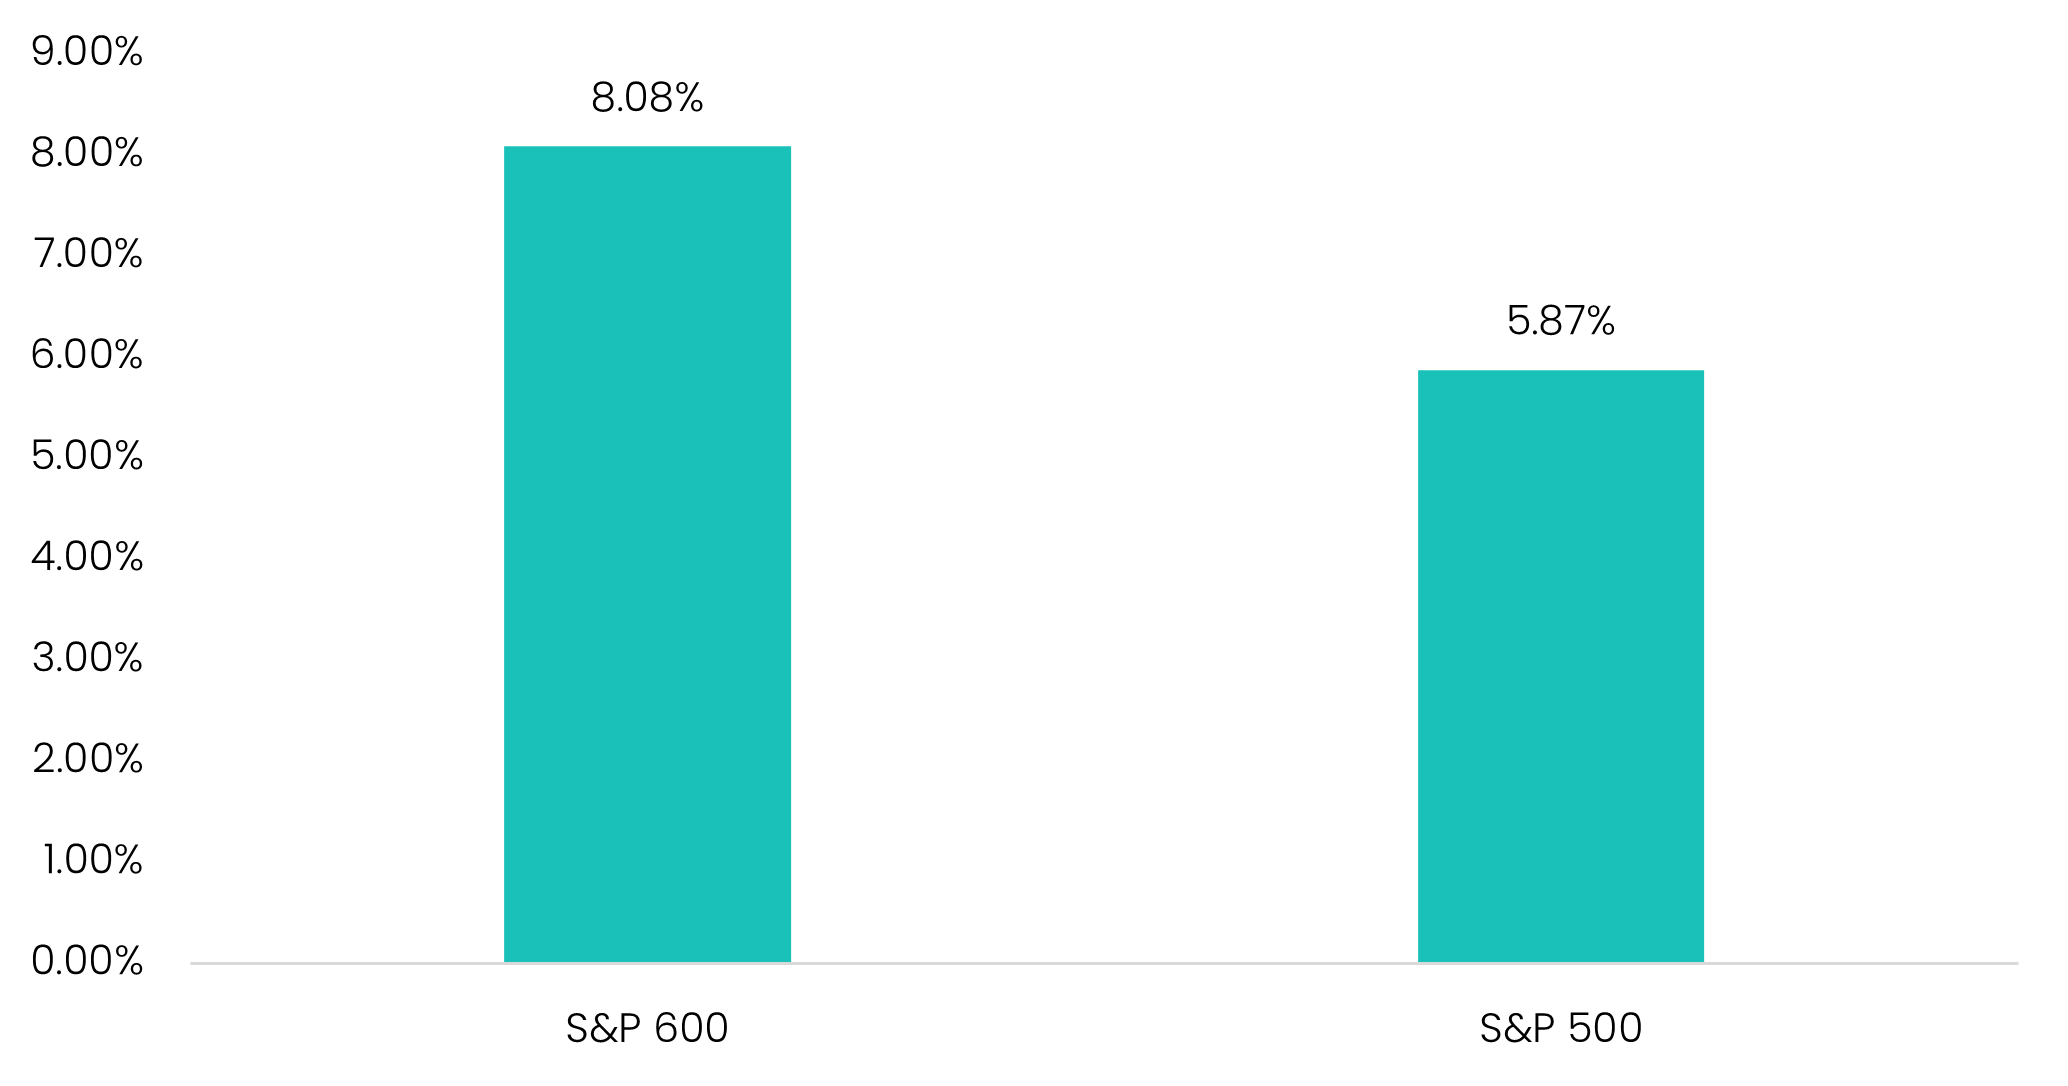
Source: S&P Global, Savana. Average three-year normalised net income growth between 31 December 2006 to 31 December 2025.
While the S&P 500 has benefitted from a historic surge in mega-cap technology stocks since 2020, such narrow leadership has driven a significant concentration in the composition of the index. As of February 2026, the top 10 stocks, including NVIDIA, Microsoft, Apple, Alphabet and Meta, account for 36.4% of the index. This is approximately double the share of the top constituents in 2010. The shift has also led to a more concentrated sector profile, with Information Technology representing 32.4% of the index
By comparison, the S&P Small Cap 600 exhibits far broader stock-level participation, with the top 10 companies representing just 5.8%, alongside a more balanced distribution of sector exposures.
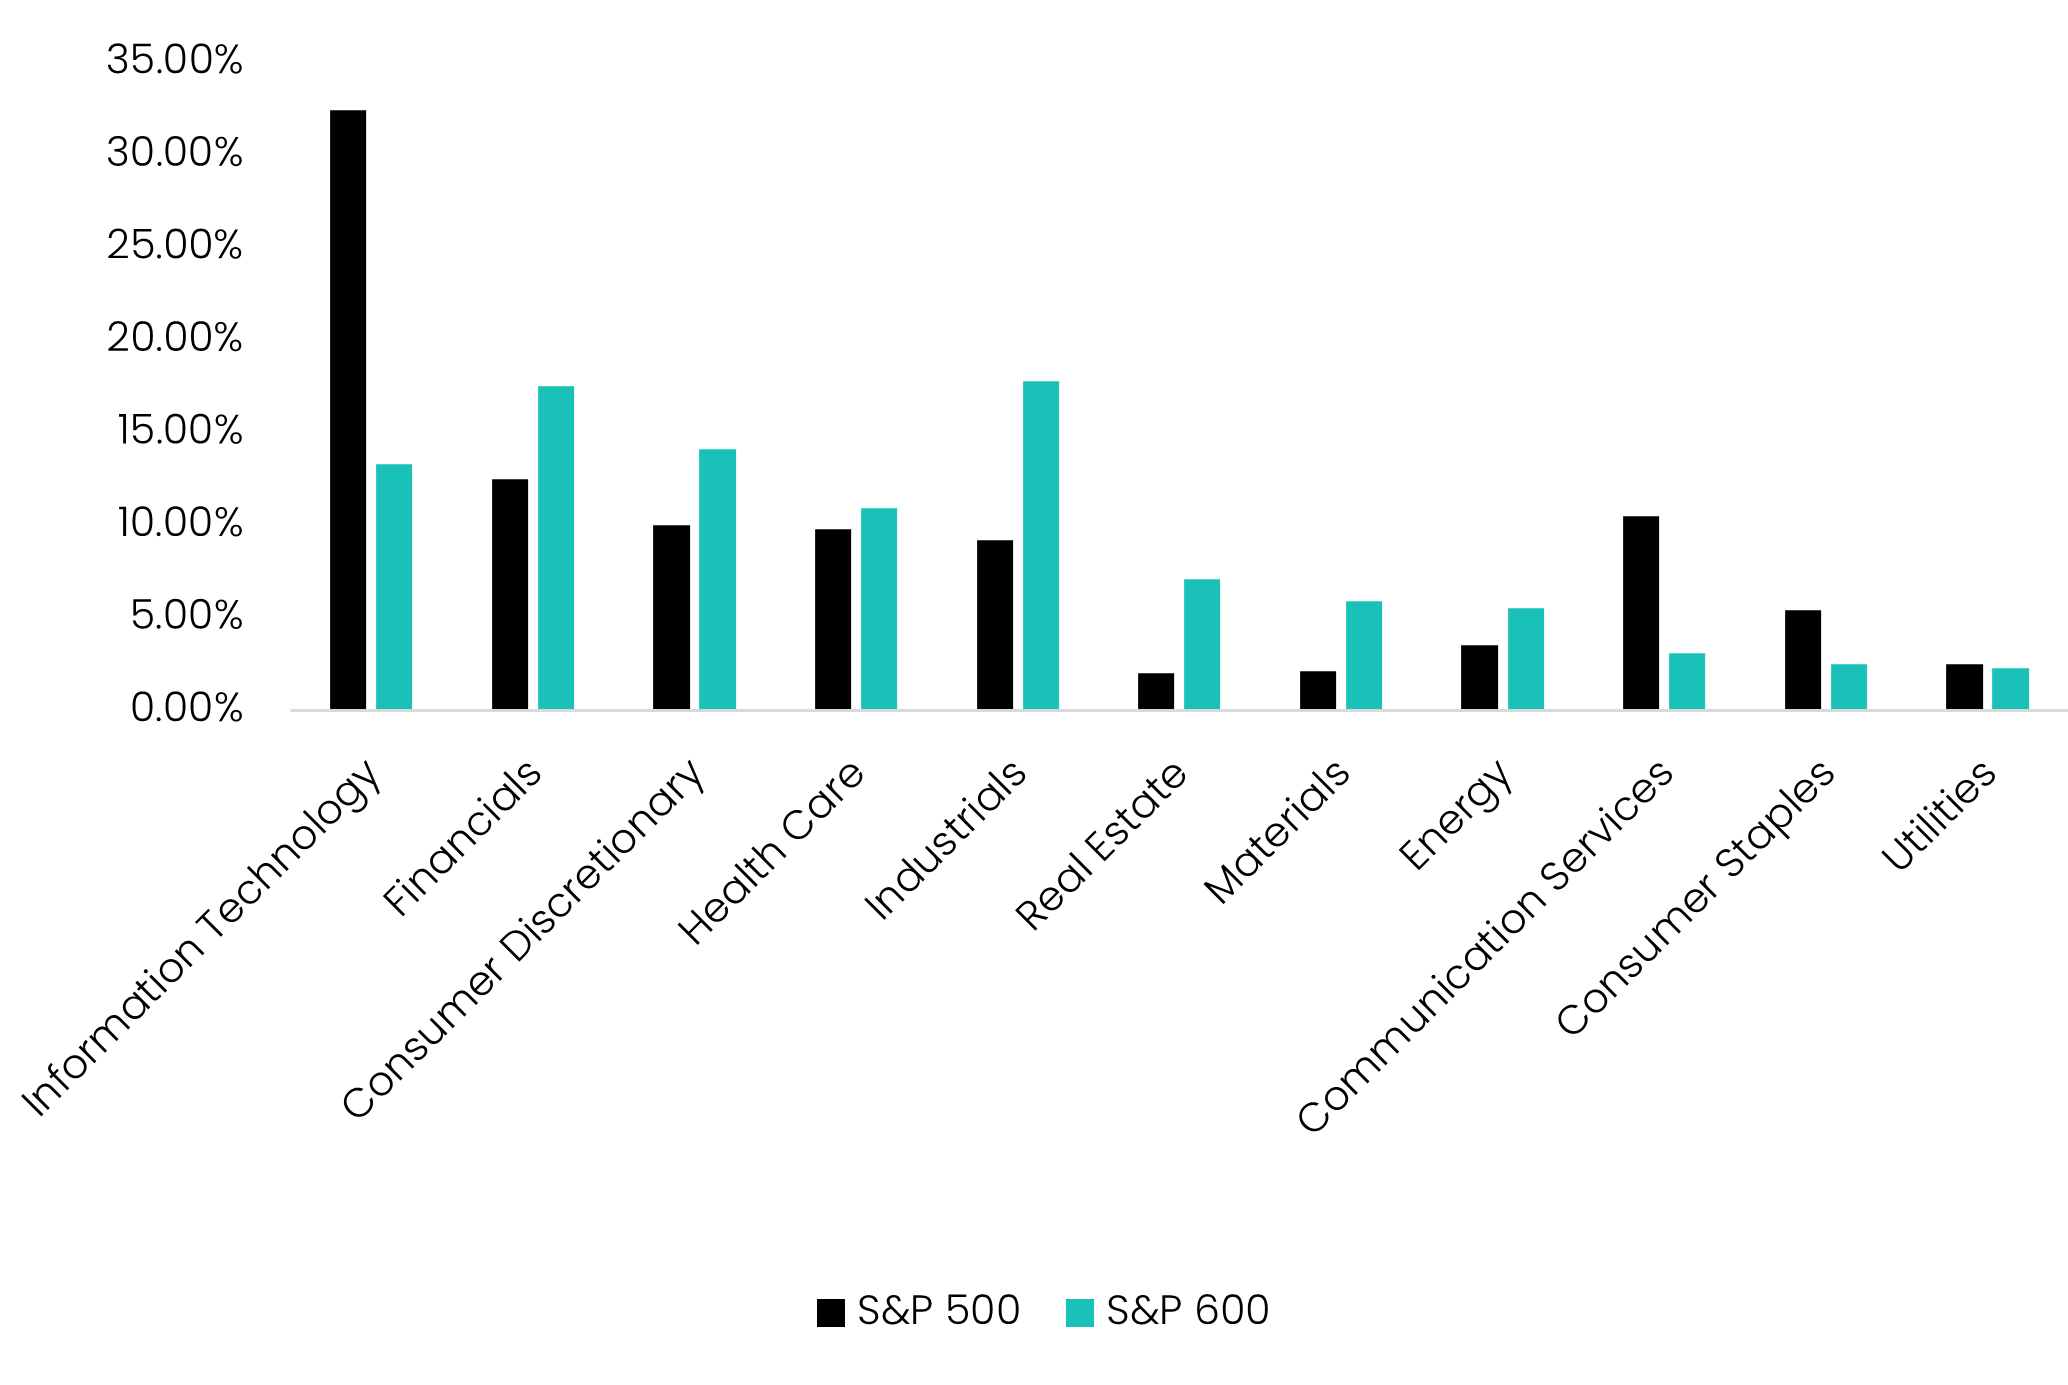
Source: S&P Global, Savana. Index breakdown by sector, measured by total market capitalization.
Perhaps the most compelling feature of the US small-cap universe is that it remains structurally inefficient.
Unlike large-cap stocks - which are intensively covered by analysts, institutions, and passive flows - small caps operate in a much thinner information environment. Many companies receive limited sell-side coverage, and institutional ownership is often fragmented. This creates the conditions for persistent mispricing, which is exactly what Savana’s algorithmic valuation engine is built to exploit.
Our algorithm scores every company across the US listed equity universe on a continuous scale, where values below 0.5 indicate undervaluation, above 0.5 indicate overvaluation, and 0.5 represents fair value.
Consistently, this process reveals that the vast majority of undervalued opportunities are in smaller companies, whereas large and mega-cap stocks tend to cluster closely around fair value.
We believe Savana’s approach works best in exactly this environment - a high-conviction, algorithmically-driven portfolio targeting the segment where mispricing is most persistent.
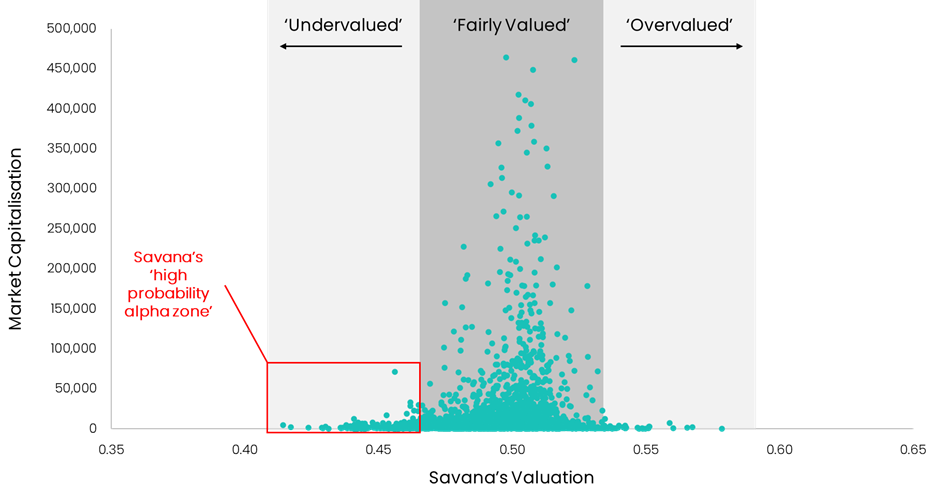
Source: Savana. Savana’s valuation of NYSE and Nasdaq listed companies with minimum market capitalisations between US$500m and US$500bn as of 28 February 2026. Valuations represent the opinion of Savana’s algorithmic process and do not represent definitive measures of intrinsic value.
Despite the benefits of the US Small Cap segment, dedicated access for Australian investors remains limited. While there are many global small cap funds and ETFs, these dilute - rather than concentrate - the opportunity. In our view, the investment case is strongest when US Small Caps are accessed directly.
The only ASX-listed ETFs that provide direct exposure are:
1. iShares Core S&P Small-Cap ETF (ASX: IJR) – passive ETF tracking the S&P Small Cap 600 index.
2. Global X Russell 2000 ETF (ASX: RSSL) – passive ETF tracking the Russell 2000 index.
3. Savana US Small Caps Active ETF (ASX: SVNP) - active ETF aiming to outperform the S&P Small Cap 600 index.
Of these, SVNP is the only strategy delivering an active approach. This unlocks the broad advantages of US Small Cap investing – performance and diversification – while also exploiting the structural inefficiencies that persist within the segment. This is evidenced by the fact that SVNP maintains a high 0.91 correlation to the S&P Small Cap 600 (even with a high-conviction portfolio of 30-50 stocks) yet has still delivered 11.34% per annum of outperformance.
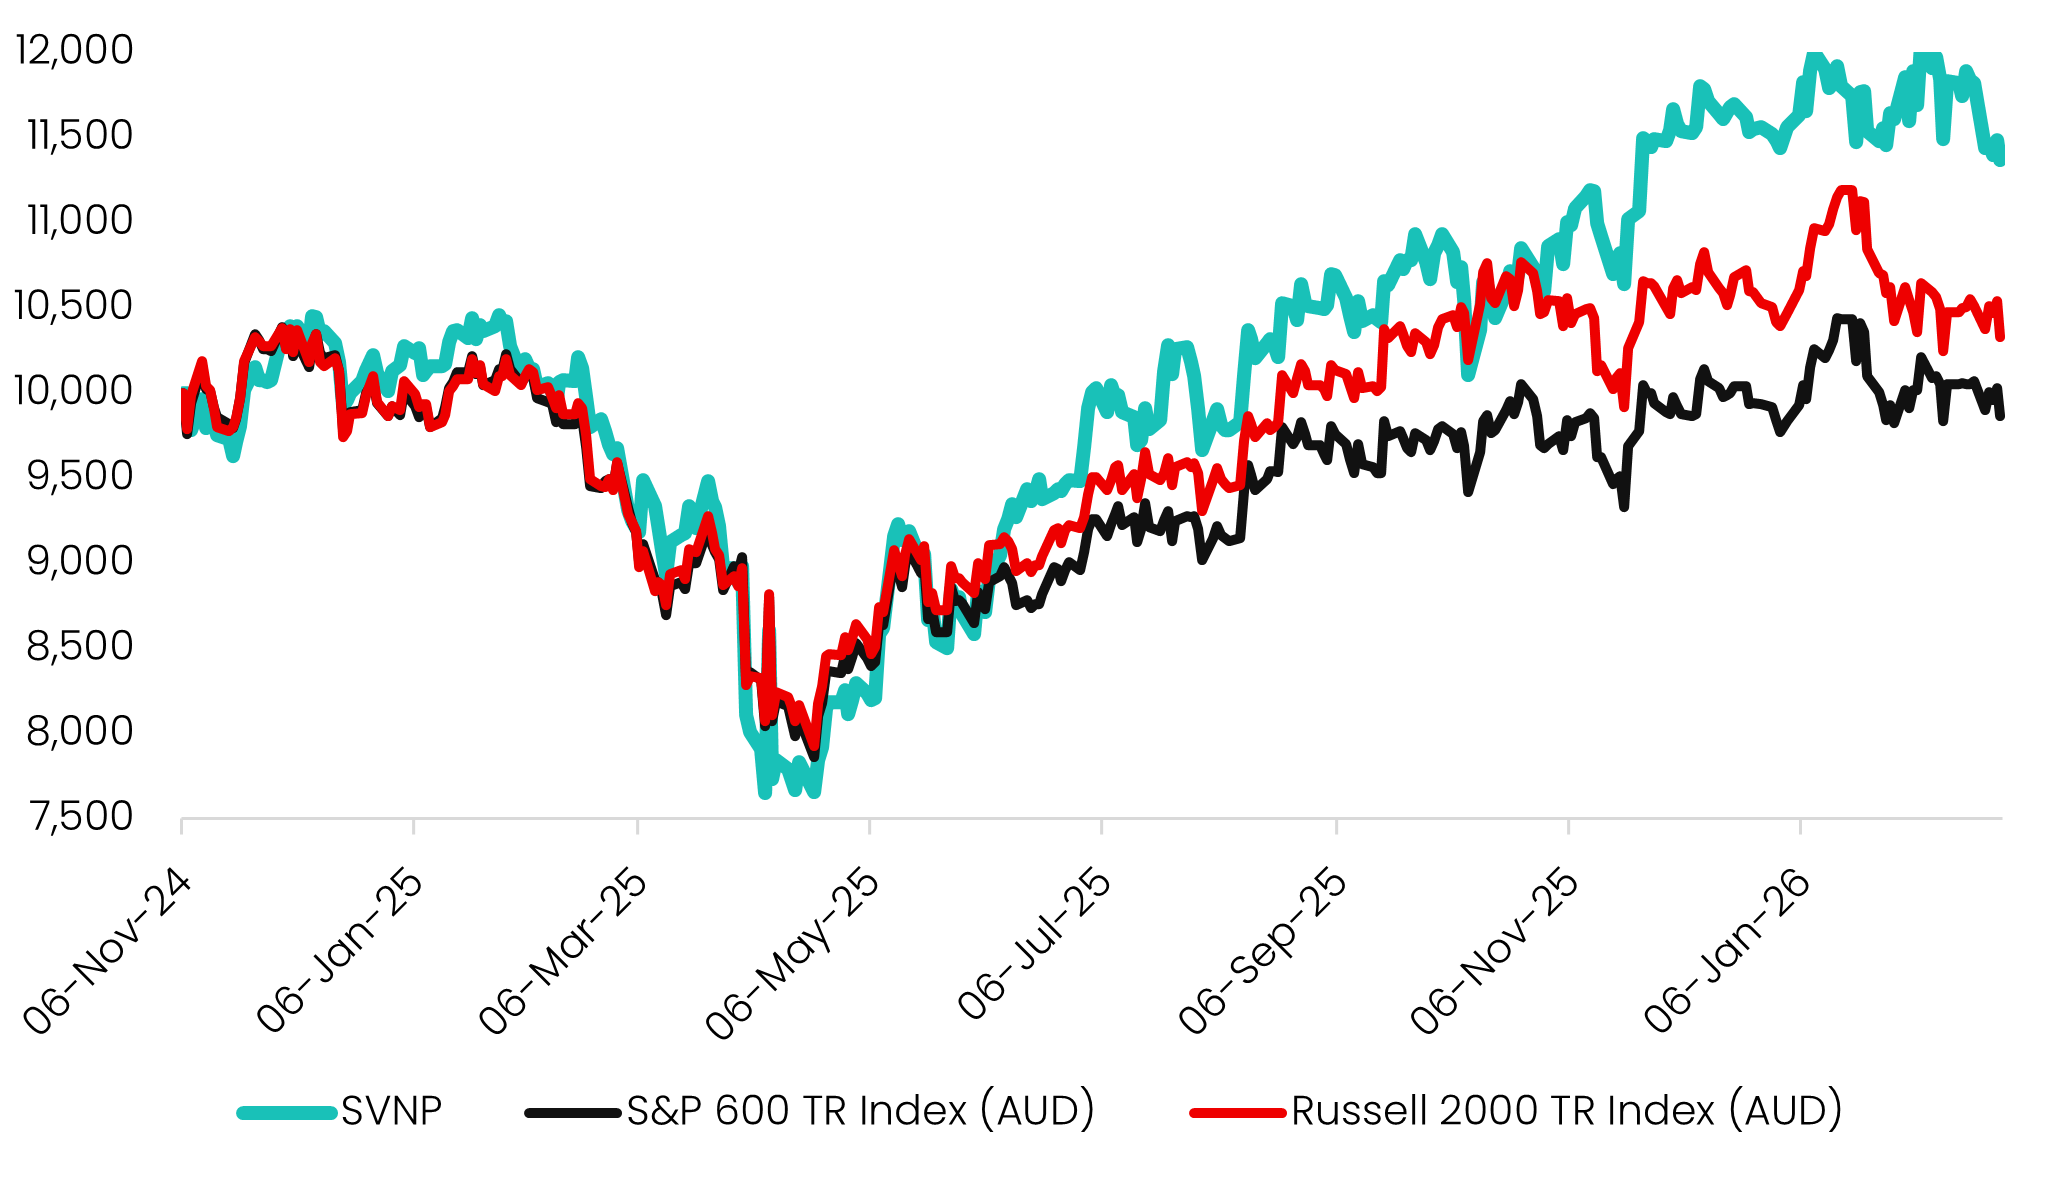

Source: Savana, S&P Global. Performance between inception on 6 November 2024 to 28 February 2026. SVNP returns are after fees and costs. Past performance is not indicative of future performance.
US Small Caps offer a unique combination of long-term return potential, diversification benefits, and structural inefficiencies. The Savana US Small Caps Active ETF (ASX: SVNP) is designed to harness this opportunity through a disciplined, fully digital investment process built for modern markets. In our view, the combination of strong underlying index dynamics with precision-driven active management positions SVNP as a compelling opportunity for Australian investors to access the full potential of US Small Caps.
1 Source: S&P Global, Savana. Gross total return index performance, based on local currency, between 1 January 2001 to 31 December 2025.

.png)