After bragging about SVNP’s 100% batting average in the previous edition of this newsletter, February delivered a timely reminder of the market’s penchant for humbling investors.
In a challenging month for fund managers, the fund declined -2.02% (net of fees). At the stock level, performance across the portfolio was broadly flat. Instead, currency movements were the primary driver of returns, with the USD depreciating a further -1.8% over the month, weighing on performance.
February will likely be remembered as a month of reckoning for software stocks - what some have dubbed the “SaaSpocalypse.” Concerns around AI-driven disruption – triggered by the release of Anthropic’s Claude Code - swept through the sector, triggering a sharp sell-off. In Australia, several well-known technology companies were among the hardest hit, including WiseTech (-18.0%), Xero (-11.3%) and Life360 (-10.4%). The S&P/ASX All Technology Index has now declined roughly 33% over the past six months.
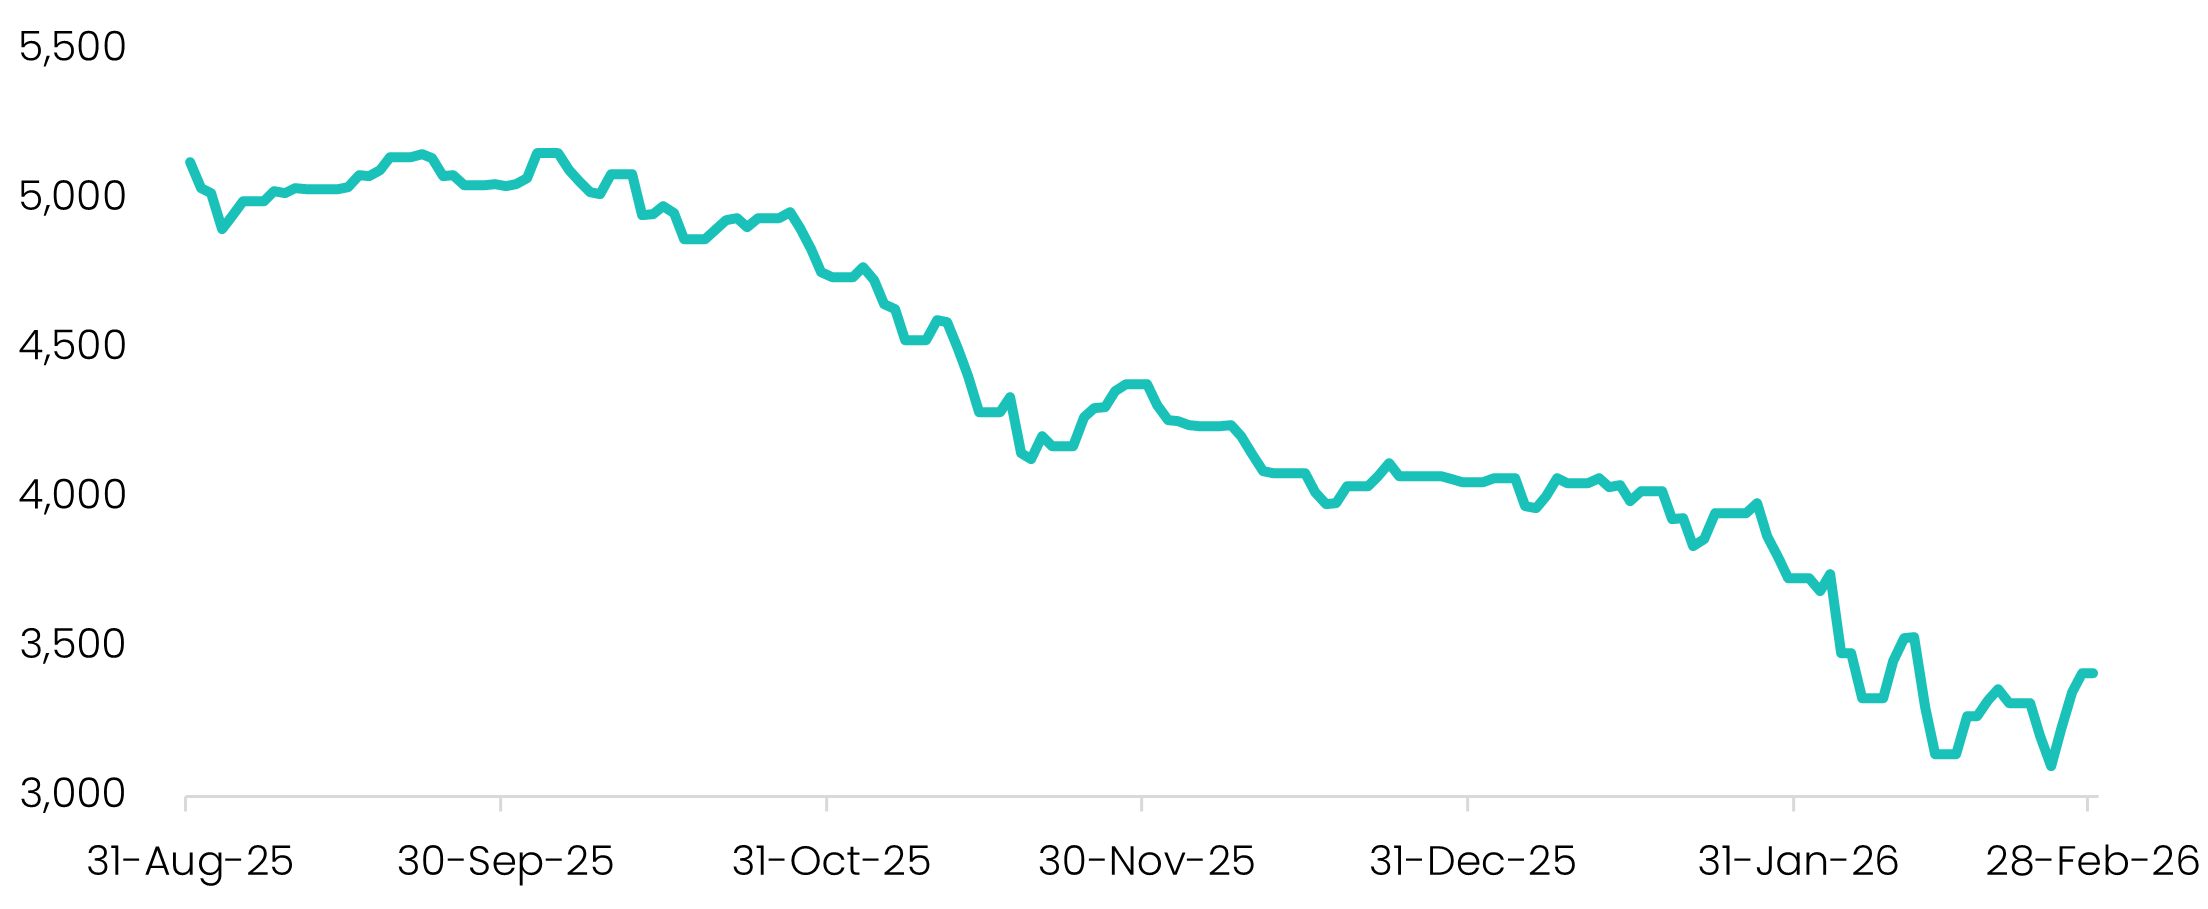
Source: S&P Global, Savana. All Technology Total Return Index from 31-Aug-25 to 28-Feb-26.
Somewhat ironically, despite being widely viewed as the disruptor, the AI trade itself has also lost momentum. NVIDIA reported another exceptional set of results during the month - including 73% year-on-year revenue growth and a 6.6% earnings beat - yet its share price still fell following the announcement and remains down year-to-date.
Taken together, these moves highlight the uncertainty currently gripping the technology sector. Investors are predicting that traditional software companies will lose to AI - yet remain unconvinced that AI companies themselves will ultimately capture the economic upside, given the enormous capital requirements, intense competition and still-uncertain long-term economics of the industry.
History suggests this dynamic is not unusual. Transformational technologies - from the Industrial Revolution to the railway boom - have often created enormous economic value without necessarily rewarding the most obvious participants. The key question for investors, therefore, is not whether value will be created, but where it ultimately accrues.
One place where the impact is already visible is capital investment. In 2025 alone, Amazon, Microsoft, Alphabet and Meta invested a combined A$329 billion in AI infrastructure, representing a 66% year-on-year increase, according to S&P Global. According to JP Morgan, AI-related capex contributed 1.1% to GDP growth in the first half of 2025.
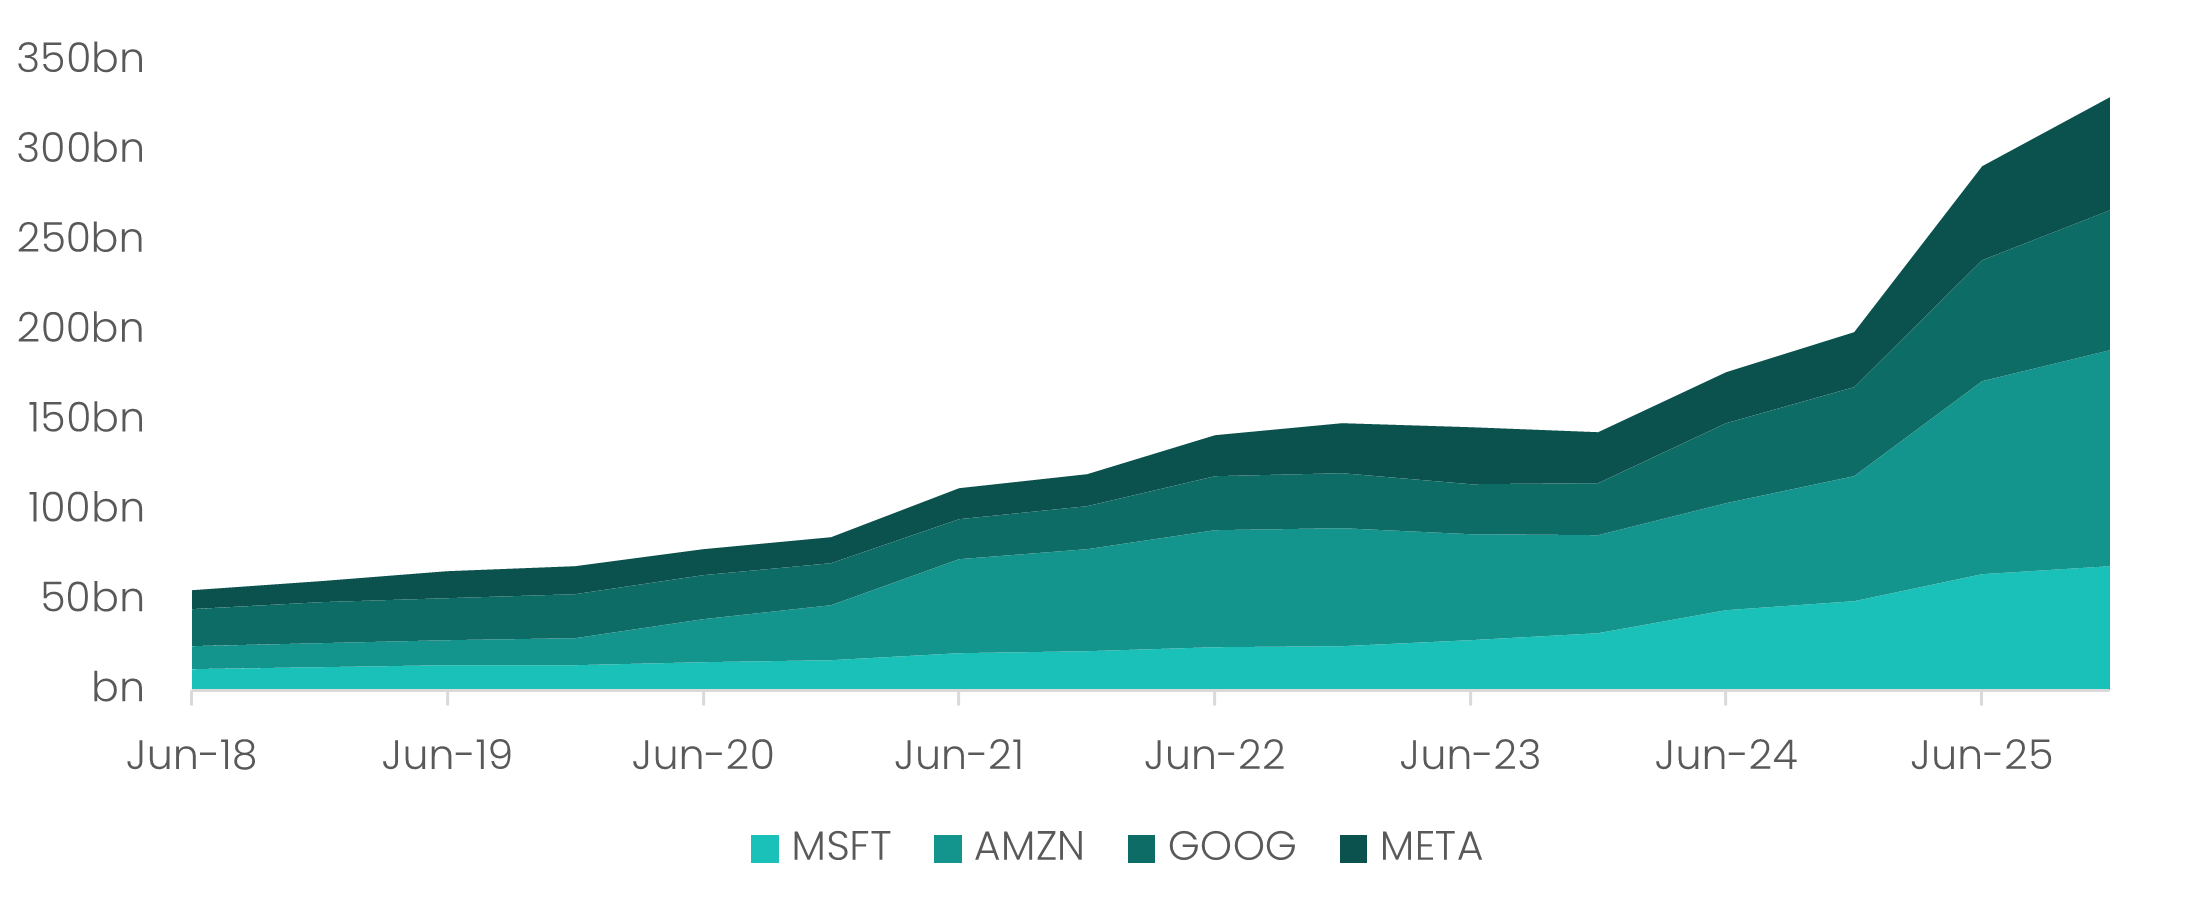
Source: S&P Global, Savana. LTM Capex spend by Company, 30-Jun-18 to 31-Dec-25.
And while the spending originates with the mega-cap technology companies, much of the economic benefit ultimately flows further down the supply chain - to the industrials, manufacturers and specialised equipment providers building the physical backbone of the AI economy. Many of these businesses sit within the U.S. small and mid-cap universe, which creates a fertile hunting ground for active investors.
In August last year, this newsletter discussed the emergence of a ‘great rotation’ from tech-heavy large caps to value-oriented small caps, driven by shifting economic conditions and the gradual fading of peak AI exuberance. Since then, the S&P 600 small-cap index has outpaced the S&P 500 by more than 3%.
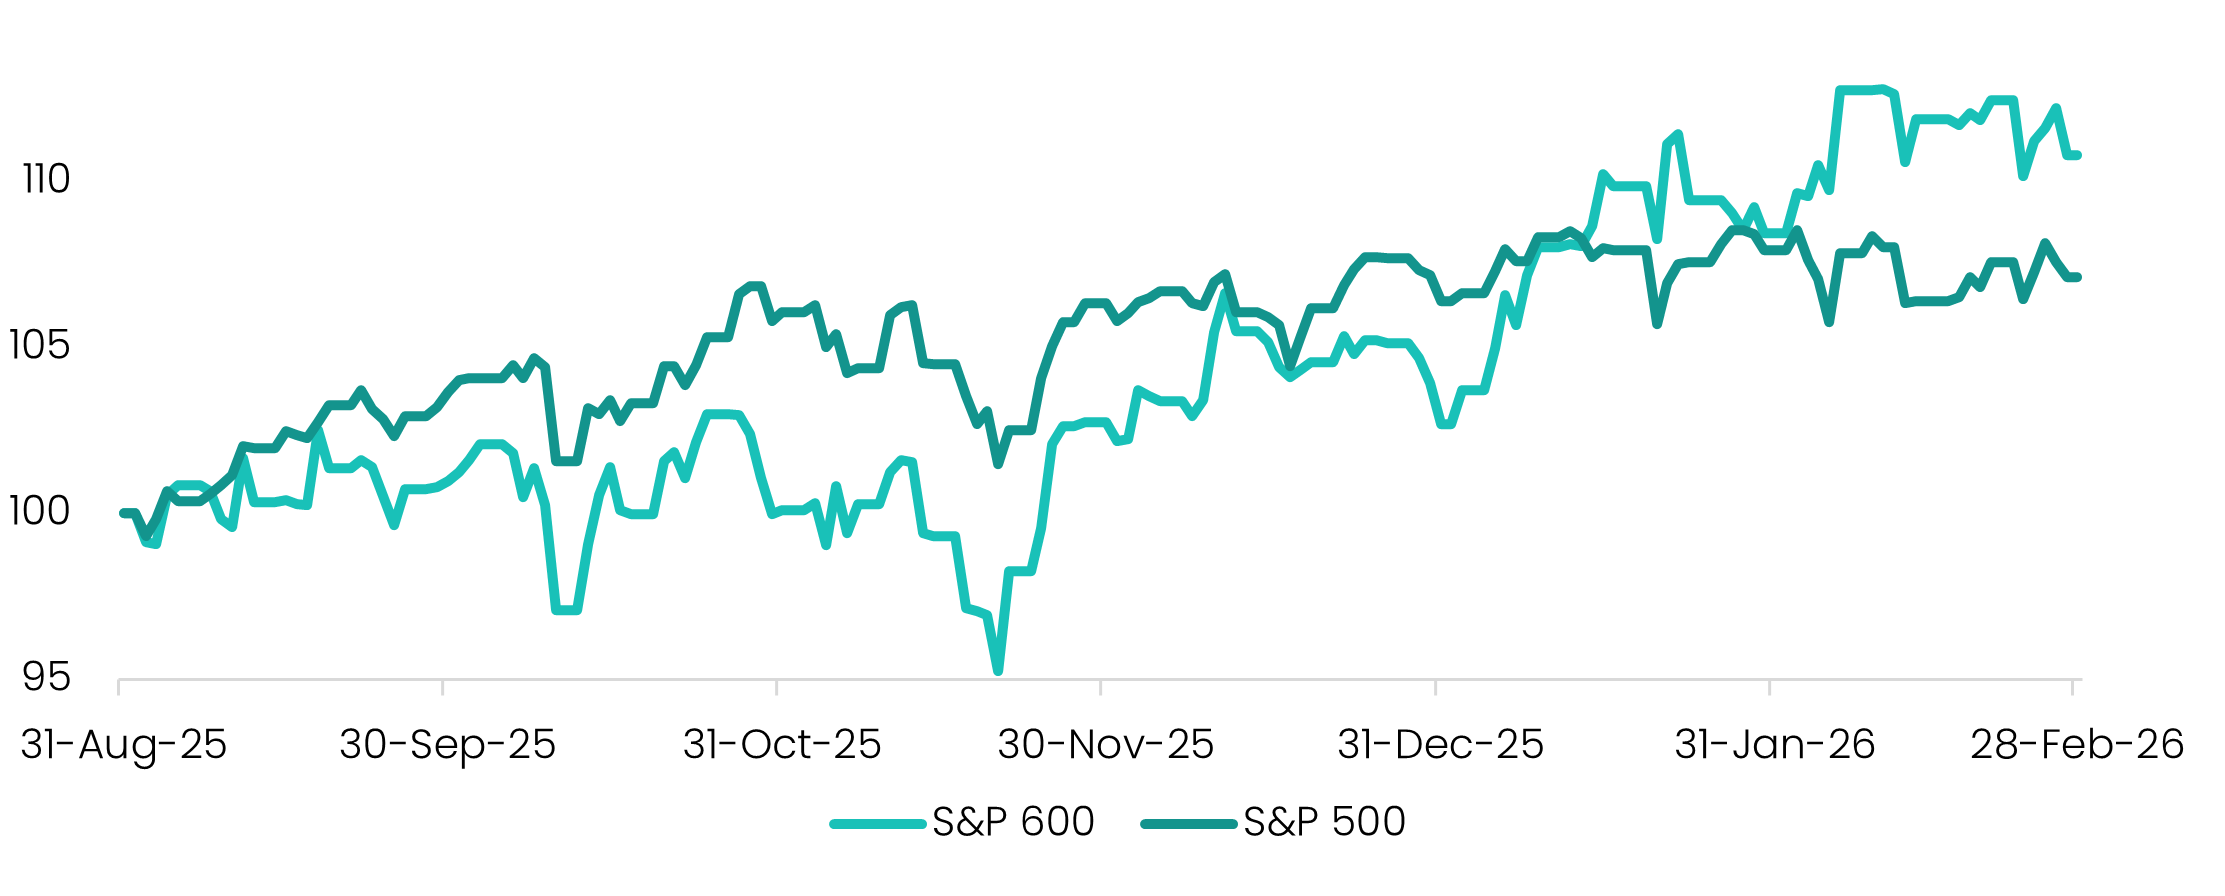
Source: S&P Global, Savana. Index Total Returns from 31-Aug-25 to 28-Feb-26.
This structural transition is also evident within the S&P 500 itself. Year-to-date returns have been led by more cyclical, value-oriented sectors - most notably utilities, energy and materials - while several of the previously dominant technology and consumer discretionary names have lagged. Similarly, the S&P 500 Value segment leads the broader index by more than 3%.
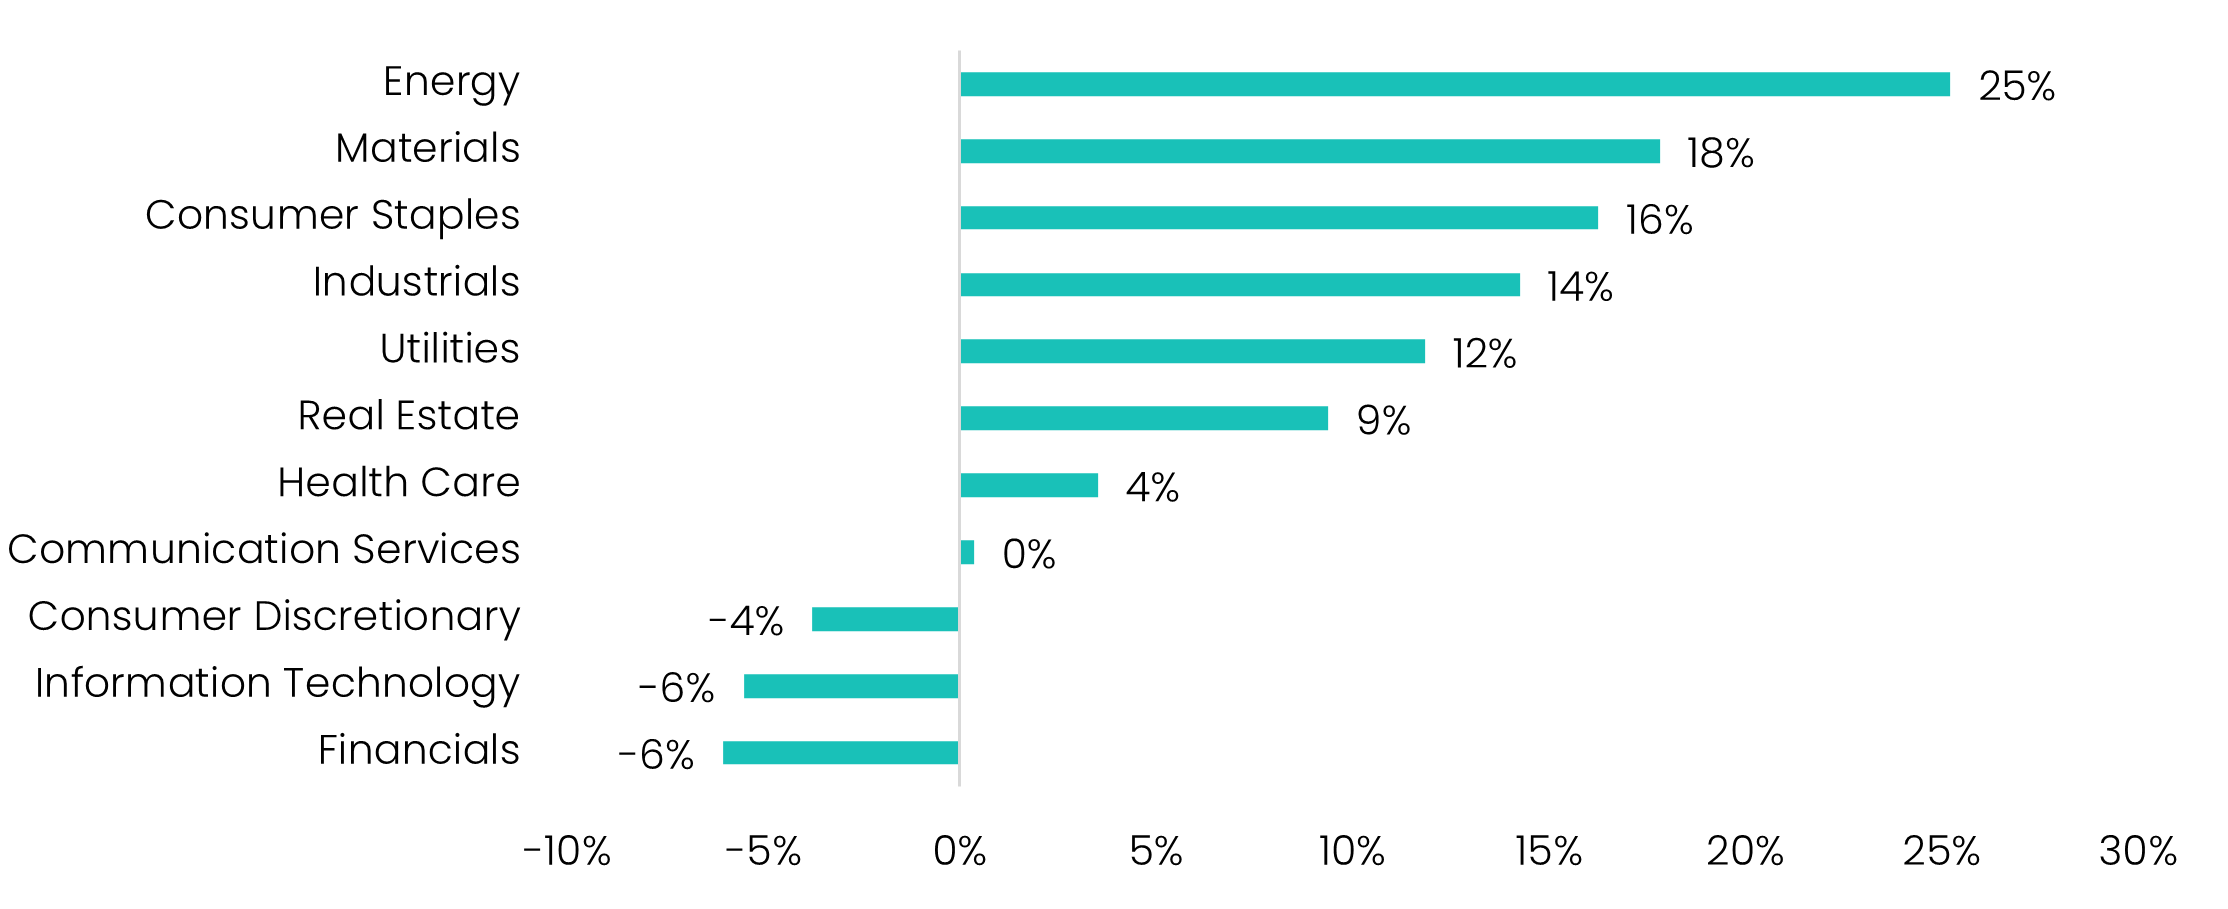
Source: S&P Global, Savana. S&P 500 Sector Returns from 31-Dec-25 to 28-Feb-26.
Importantly, this shift is occurring against a backdrop of resilient corporate fundamentals. According to FactSet, S&P 500 year-on-year earnings growth reached 11.6% in Q1-26, marking the sixth consecutive quarter of double-digit growth. The combination of earnings momentum and a broadening of capital investment provides continued support for small caps, which are typically more sensitive to domestic economic activity and capital spending cycles.
Among other things, February’s “SaaSpocalypse” served as a useful reminder of the importance of diversification. Several fund managers experienced sharp drawdowns during the month after becoming heavily concentrated in technology and AI-related names. The temptation is understandable. Over the past decade - until quite recently - technology stocks have significantly outpaced major benchmarks, providing a seemingly easy path to outperformance.
While momentum-driven positioning can be highly profitable for extended periods, it can also unravel quickly when sentiment turns - as many investors are now discovering.
Savana’s portfolios, while high-conviction across 30–50 holdings, also tend to be well diversified across industries. By its very nature, our investment approach avoids chasing ‘hot stocks’ or crowded themes, instead favouring companies with strong fundamentals trading at attractive valuations. We believe this disciplined design positions the portfolio for steady, long-term compounding.

Source: Savana. Industry exposures as of 28-Feb-26.
As Warren Buffett famously observed when asked why investors don’t simply copy his approach: “Because nobody wants to get rich slow.”