The Savana US Small Caps Active ETF (ASX:SVNP) advanced +1.28% in March, representing a +1.46% outperformance of the S&P 600 benchmark. Despite the significant volatility triggered by the conflict in Iran, the positive performance was driven largely by a 3.15% appreciation in the USD/AUD, offsetting a modest 1.81% decline at the portfolio level. Outperformance during the month was led predominately by Sarepta Therapeutics (+30%) and HighPeak Energy (+32%).
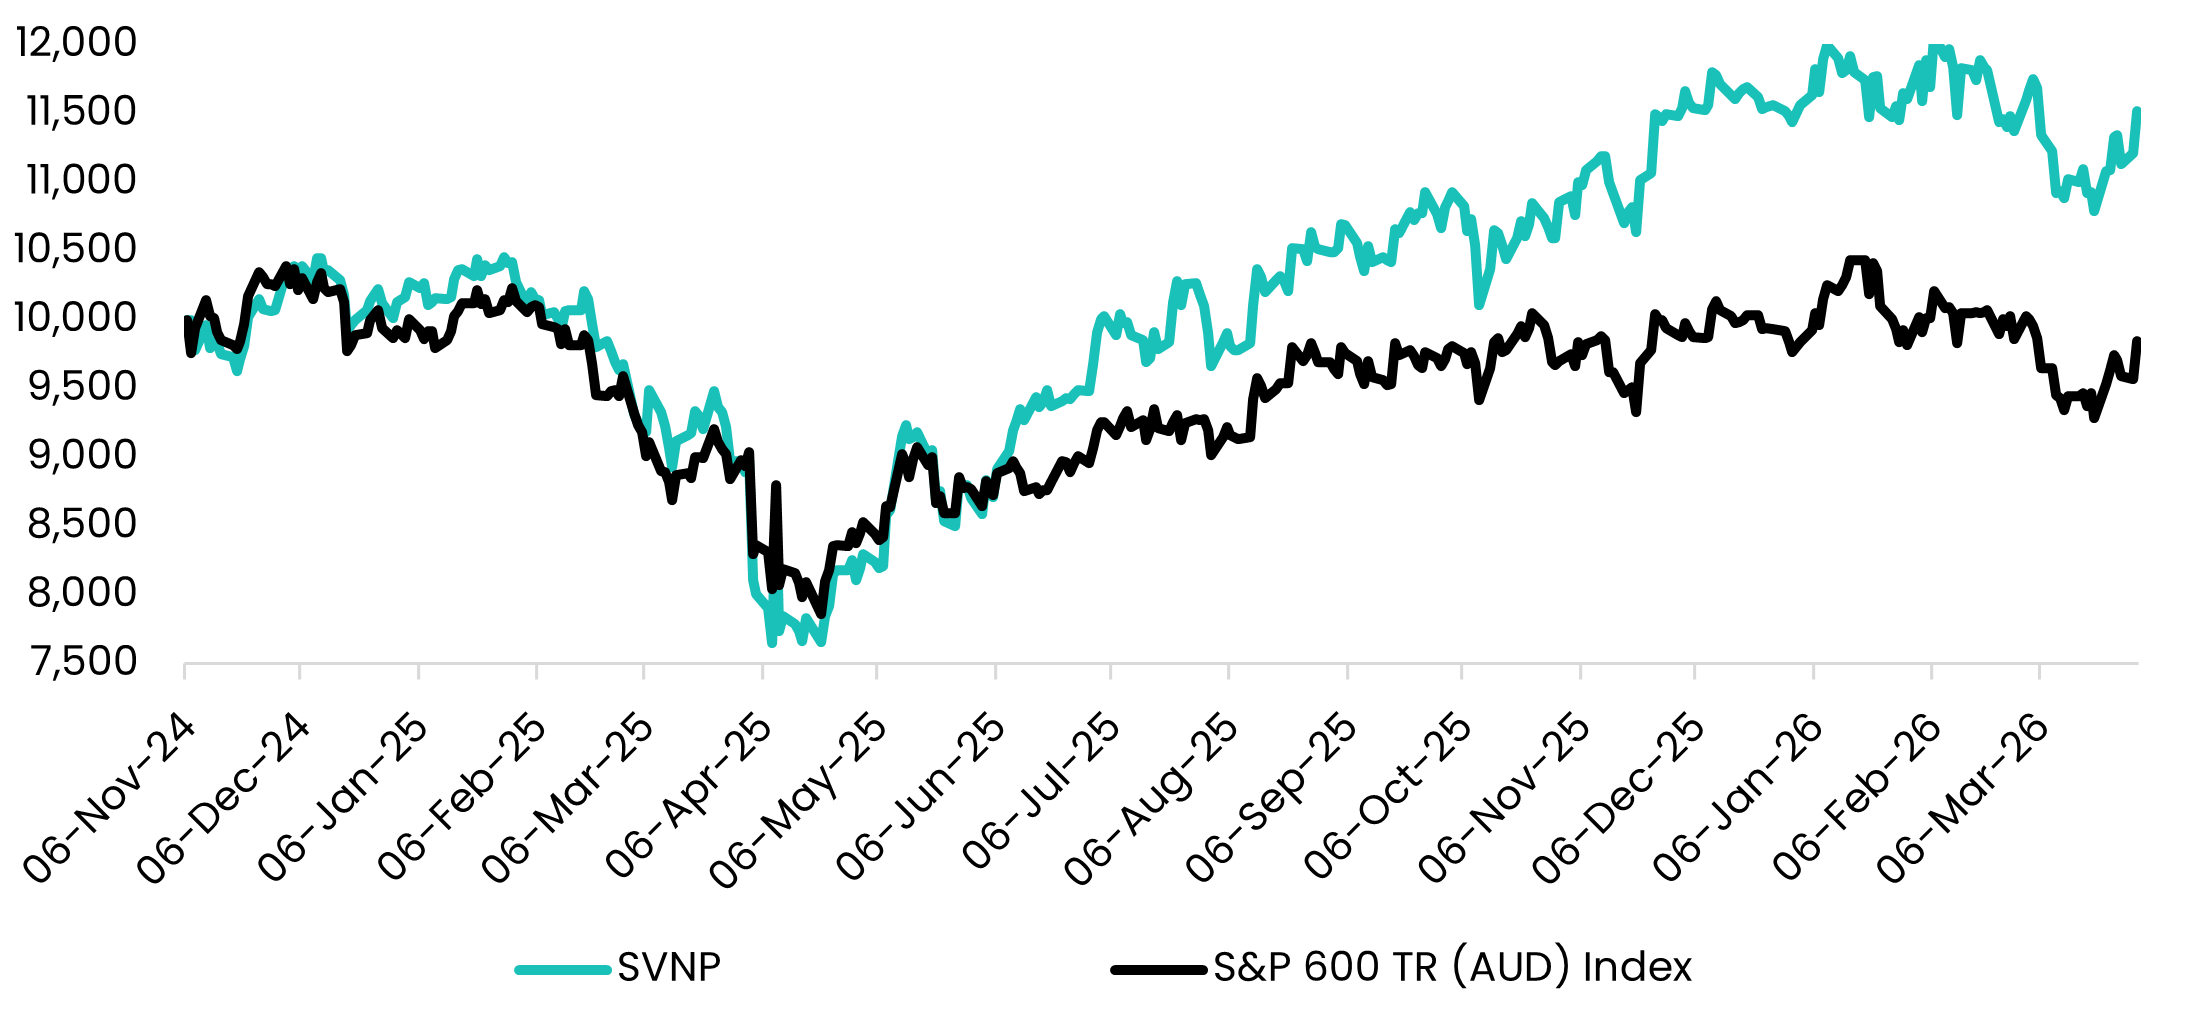

Source: Savana, S&P Global. The Savana US Small Caps strategy was implemented on the ASX as of the 6th of November 2024. Total returns are calculated in Australian dollars based on the close-of-day net asset value per unit as at the last day of the given period. Returns are after fees and costs with dividends reinvested. Returns for periods greater than one year are annualised. Past performance is not indicative of future performance.
The outbreak of conflict in Iran on the 28th of February has placed markets on a knife’s edge. The closure of the Strait of Hormuz saw one of the most dramatic oil price surges in history, with Brent crude surging from $72.48 on February 27th to $118.35 on March 31st - a staggering 63% increase in a month.
Australian bond yields have spiked to the highest levels since 2011, with the 10-year government bond yield climbing from 4.63% to 4.98% - a 35 basis point increase. Equally, the US 10-year Treasury yield has surged from 3.94% on March 2nd to 4.32% on March 31st - a rise of 38 basis points.
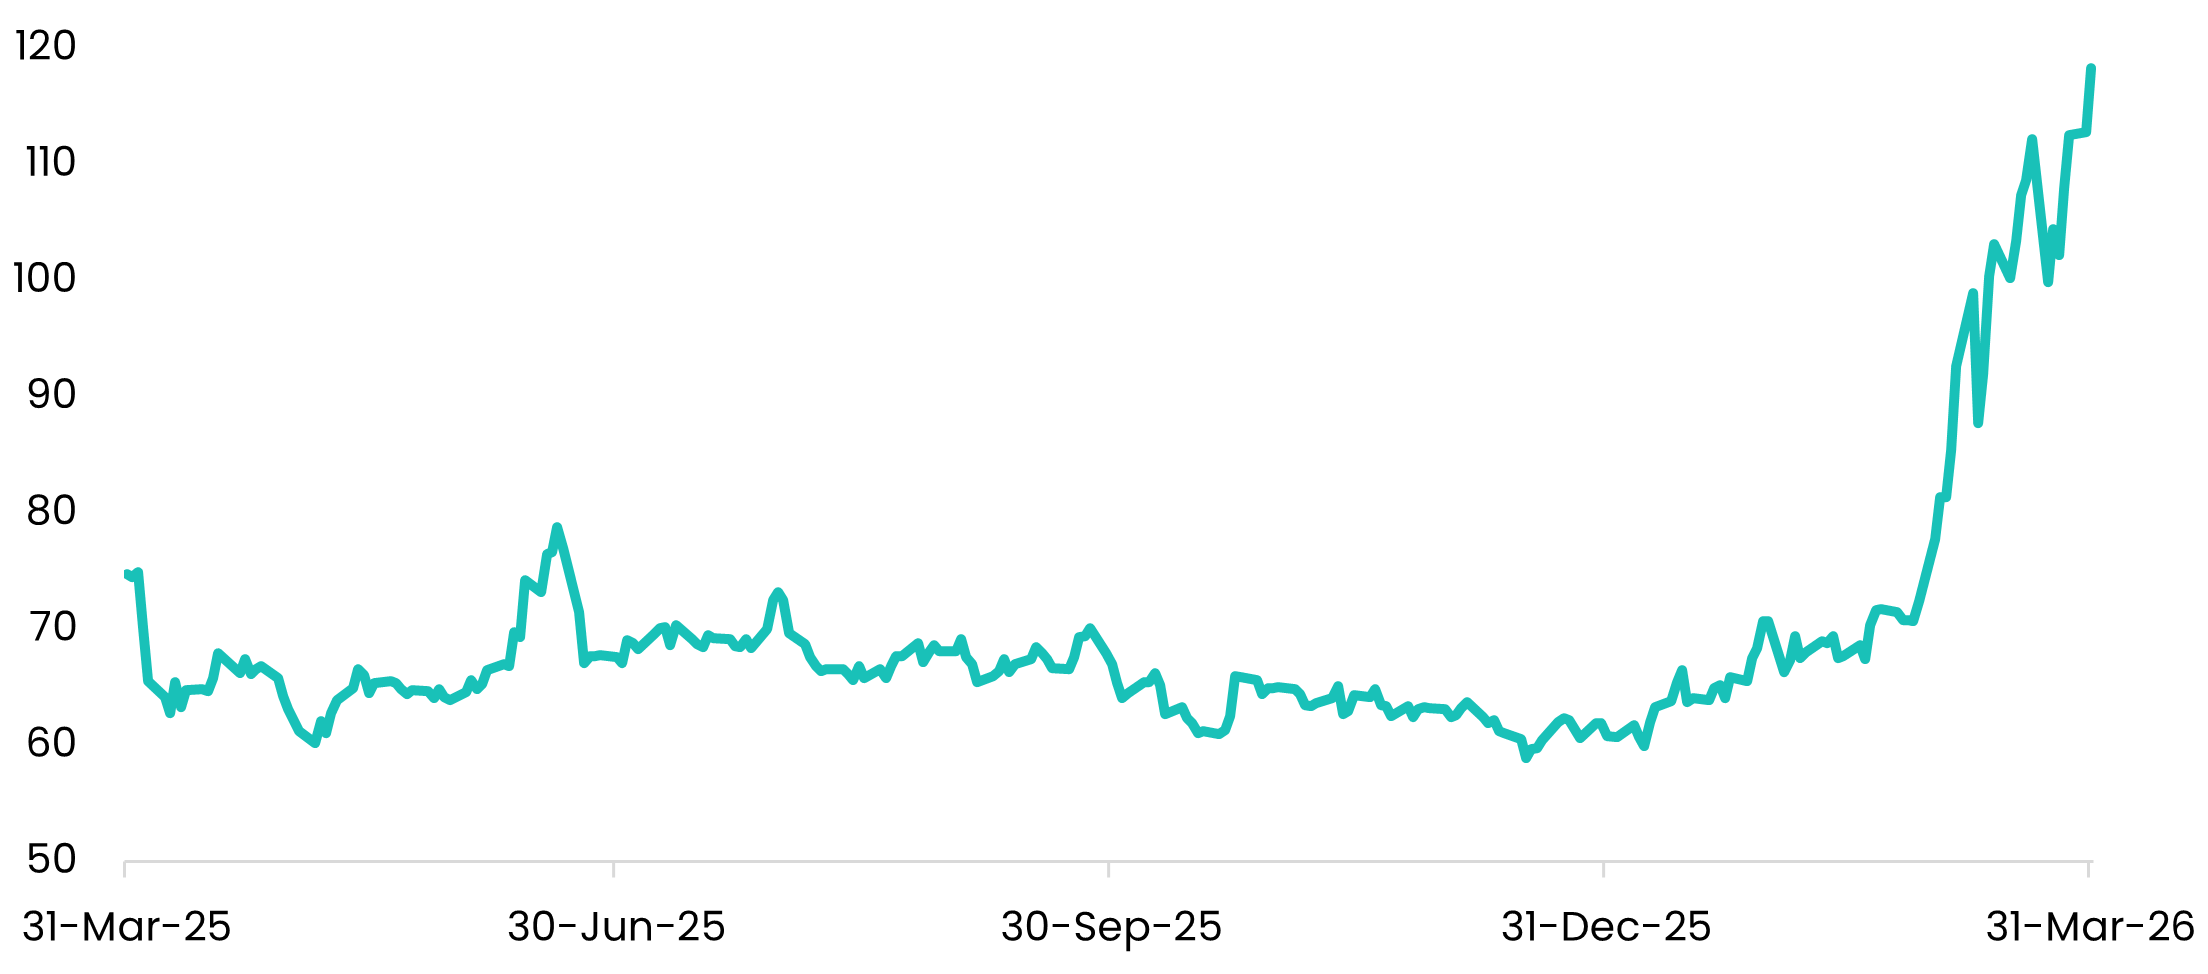
Source: Savana, Bloomberg. Brent crude oil price from 31-Mar-25 to 31-Mar-26.
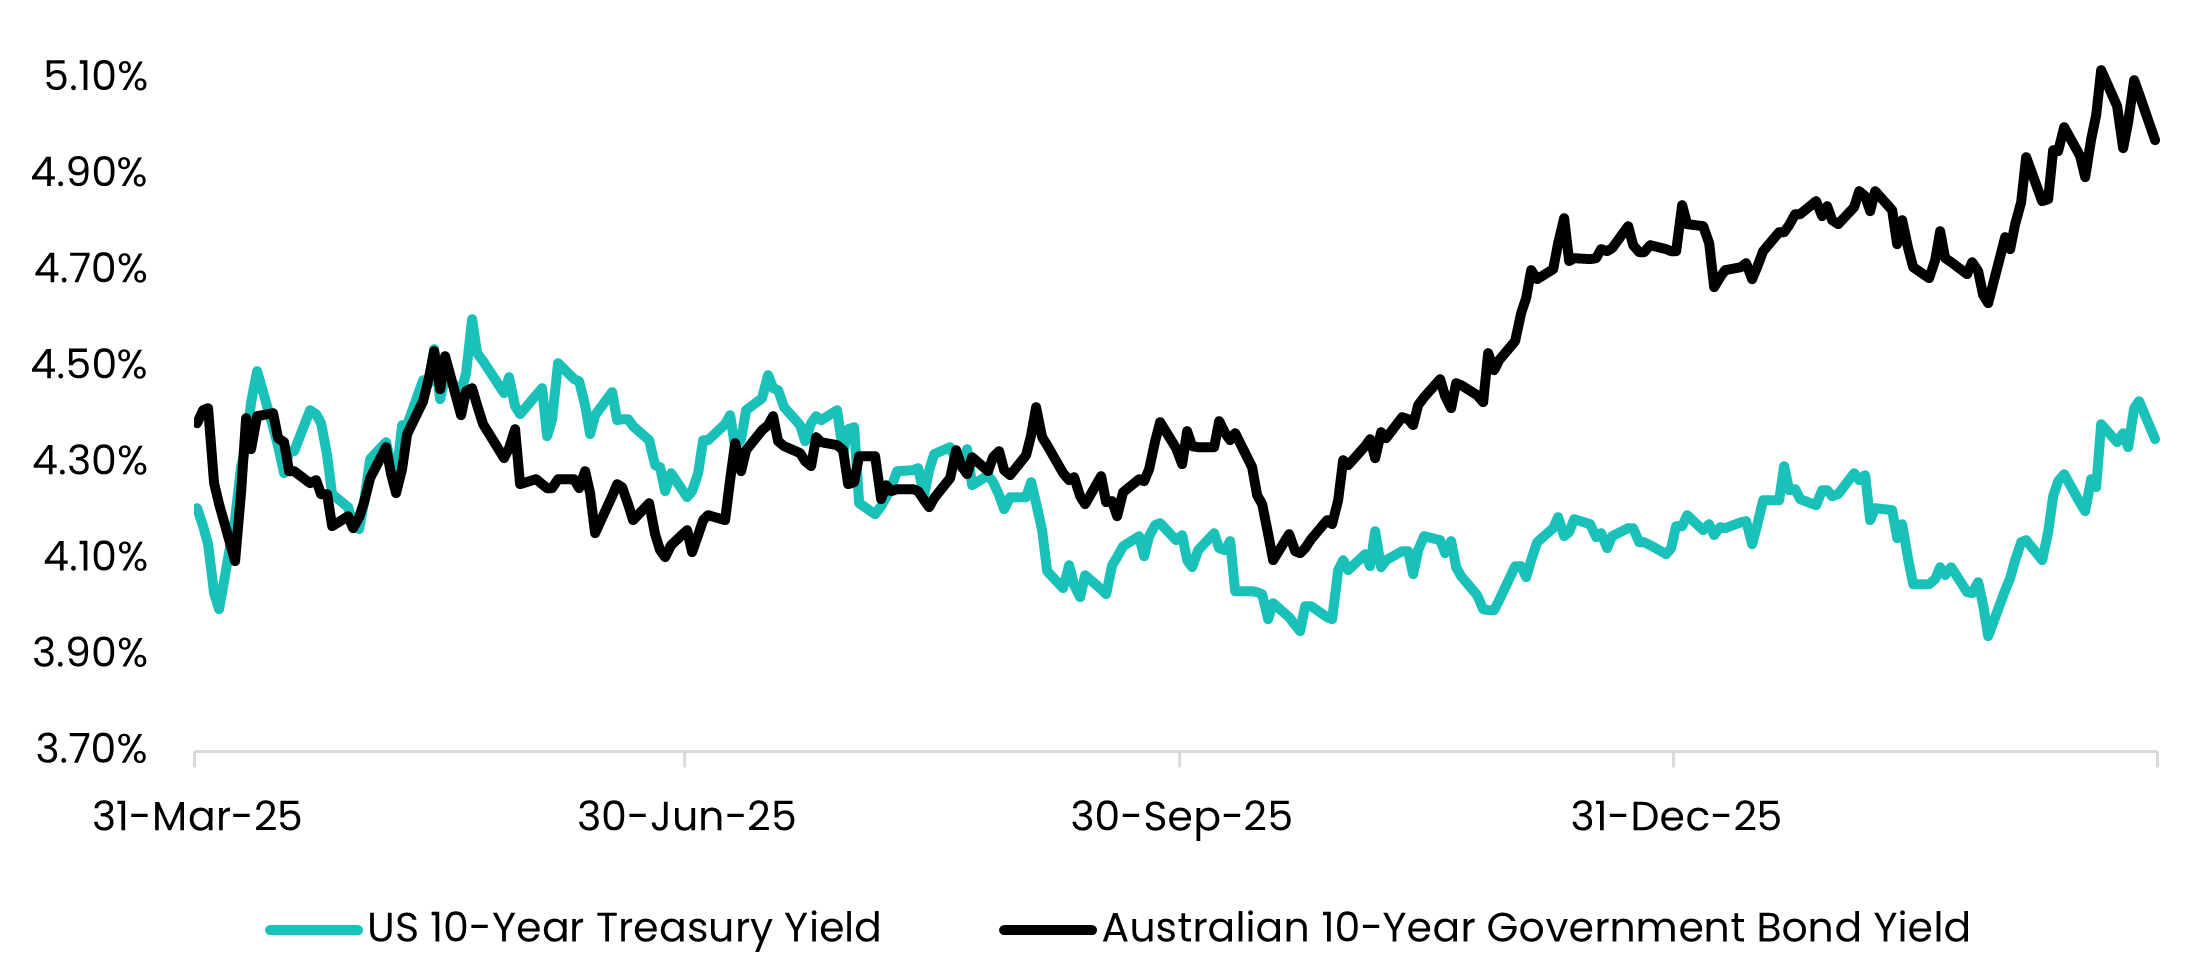
Source: Savana, Bloomberg. Bond yield performance from 31-Mar-25 to 31-Mar-26.
And yet, the response in equity markets has been surprisingly composed. Over the one-month period from February 28th to March 31st, the S&P 500 declined 4.98%, the S&P Small Cap 600 fell 4.07%, and the ASX 200 dropped 7.15%. These are meaningful movements – but still relatively modest given the magnitude of the repricing in bond markets.
Many observers argue that equity markets are perilously overlooking the downside risks, namely a continued and prolonged spike in energy prices that escalates inflationary pressures and puts a significant drag on global growth. But the collective wisdom of the market, increasingly desensitized to volatility and accustomed to 'TACO' situations, appears to be betting that a near-term resolution will prevail. Trump’s Tuesday deadline looms as a pivotal sliding-doors moment - one that could either force a rapid de-escalation, or entrench a deeper cycle of defiance and retaliation.
With both equities and bonds under pressure globally, many investors may be feeling that there is nowhere to hide. Even gold - long considered a traditional safe haven - fell by more than 10% during the course of the month.
The breadth of the sell-off points to a growing rotation into cash. But sitting on the sidelines carries its own risks, particularly in the event of a sudden de-escalation in Iran which could trigger a sharp, relief-driven rally. In our view, remaining invested through short-term volatility is an important principle of long-term wealth creation. Still, maintaining a balanced and proactive allocation across asset classes and segments is equally critical.
As the conflict in Iran continues, we believe the US stands out as one of the strongest relative opportunities. This view is underpinned by two key factors: the resilience of the US dollar during periods of distress and the structural strength of the US economy, particularly its relative energy independence.
We are often asked by investors why we do not choose to hedge our foreign exchange exposure to the US dollar in our US Small Caps ETF. The answer is that we believe that the USD exposure plays an accretive role risk-adjusted outcomes for Australian investors.
The US dollar is widely regarded as a safe-haven currency, typically strengthening during periods of market stress. By contrast, the Australian dollar is more pro-cyclical, tending to appreciate in risk-on environments. For Australian investors, this dynamic creates a naturally offsetting relationship - where currency movements can help cushion equity drawdowns while moderating returns in stronger markets. This was most clearly evidenced during the GFC in 2008, where the S&P 600 plummeted 31% while the USD/AUD appreciated 25%.
This effect was also illustrated this month. Across the 22 trading days, the US Dollar and the S&P 600 moved in opposite directions on 15 occurrences with a correlation of -0.48.

Source: Savana, S&P Global. Asset performance from 31-Mar-25 to 31-Mar-26. All index data in local currency and on a gross total return basis.

Source: Savana, S&P Global. Daily performance of USD/AUD and S&P 600 (gross total return USD) index from 2-Mar-26 to 31-Mar-26.
Compared with other major markets, the US is also relatively insulated from the Iran conflict and broader geopolitical shocks. Imports account for just 13.7% of GDP as of January 2026 - among the lowest ratios in the OECD and below peers such as the UK (32%), Germany (30%), France (23%) and Australia (20%). The US also possesses a deep and diversified mix of industries, particularly across manufacturing and industrials, providing economic self-sufficiency.
Critically, the US is fully energy self-sufficient, as the world’s largest producer of crude oil and natural gas. It is estimated that less than 10% of US oil supply is sourced from the Persian Gulf. While oil is globally priced - meaning US consumers are still exposed to higher prices at the pump - supply is comparatively secure, in contrast to regions such as Japan and Europe, which remain heavily reliant on imports.
The geopolitical events of March and all its uncertainty underscore the extreme difficulty of active investment management. Incidentally, during the month, S&P released its annual SPIVA (S&P Indices Versus Active) scorecard for the 2025 calendar year, which assess the performance of active fund managers relative to passive, index-tracking strategies.
The results show that 74% of funds in the Australian Equity General category underperformed last year, while 87% of funds have underperformed over the past 15 years. In the Global Equity General category, 96% of funds have underperformed over the past 15 years.
The results reinforce Savana’s long-held belief; that in modern markets where information is fast-flowing and prices are generally efficient, human managers can no longer deliver a durable investment edge.
That is why Savana exists: to deliver a new form of active management driven by research and science – not human guesswork.