
From a distance, 2025 may be observed as another strong year for investors, with global equity markets extending their post-pandemic run of gains. But the final results mask a year shaped by heightened uncertainty, abrupt market moves and a series of competing economic and geopolitical pressures that made the investment landscape anything but straightforward.
Source: S&P Global, Savana.
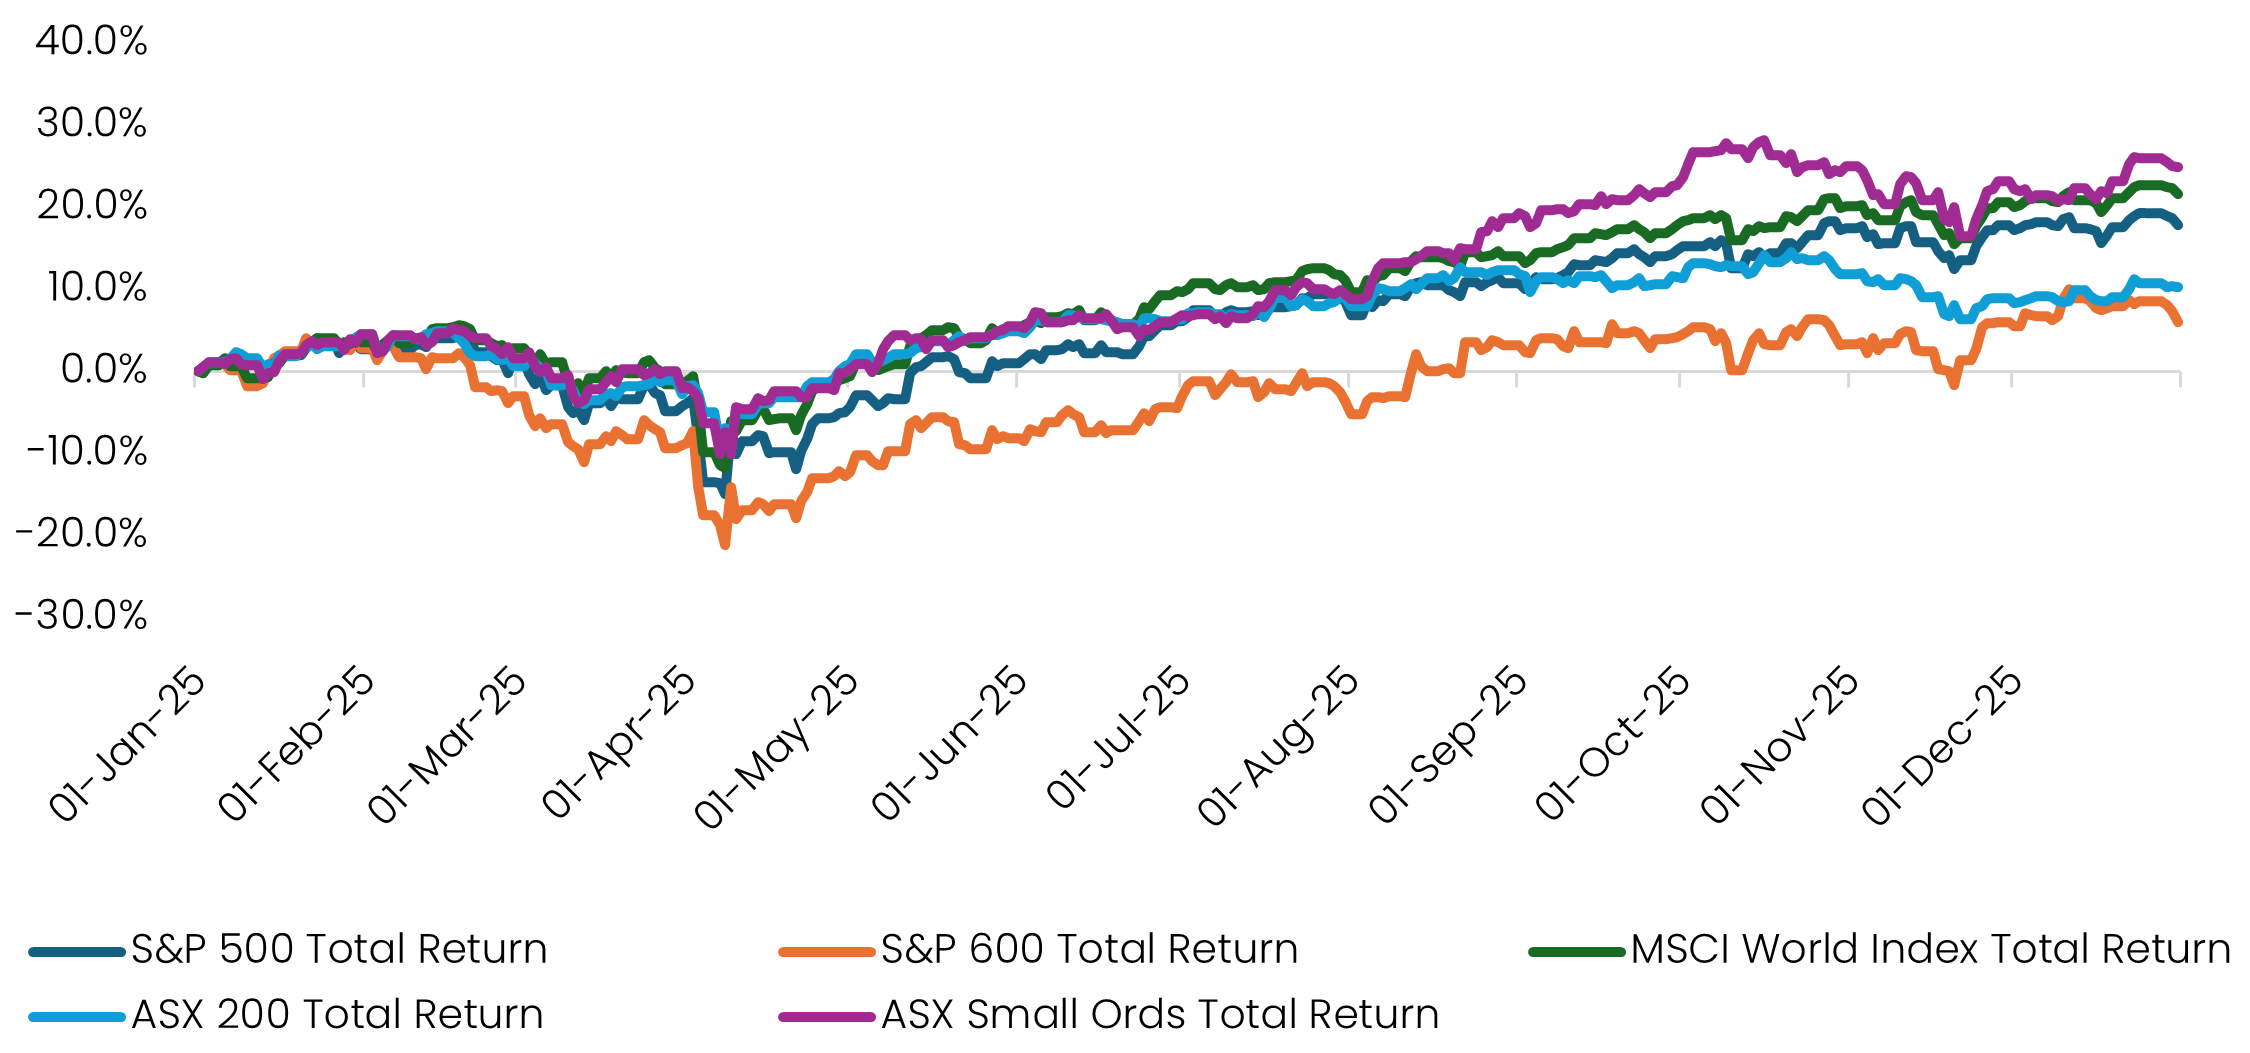
The year opened cautiously, as investors assessed the implications of a second Trump term in office. That caution turned swiftly to alarm in the second quarter, when the President’s tariff push triggered the sharpest market sell-off since the pandemic. The S&P 500 fell roughly 16% peak-to-trough, as fears around inflation, supply-chain disruption and global growth rapidly took hold.
With hindsight, the sell-off proved an overreaction. Markets once again underestimated Trump’s familiar playbook of brinkmanship and pragmatism. Initial “Liberation Day” posturing was soon followed by negotiated outcomes, including revised arrangements with the UK, Europe and Japan, alongside a tentative easing in tensions with China.
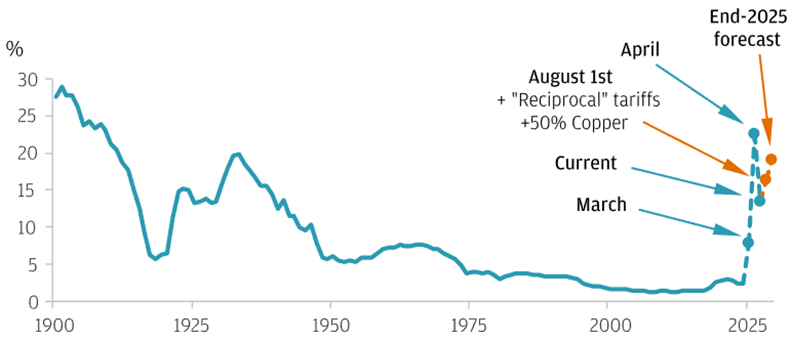
Source: JP Morgan. 2025. “US Tariffs: What’s the Impact on Global Trade and the Economy?” December 5, 2025.
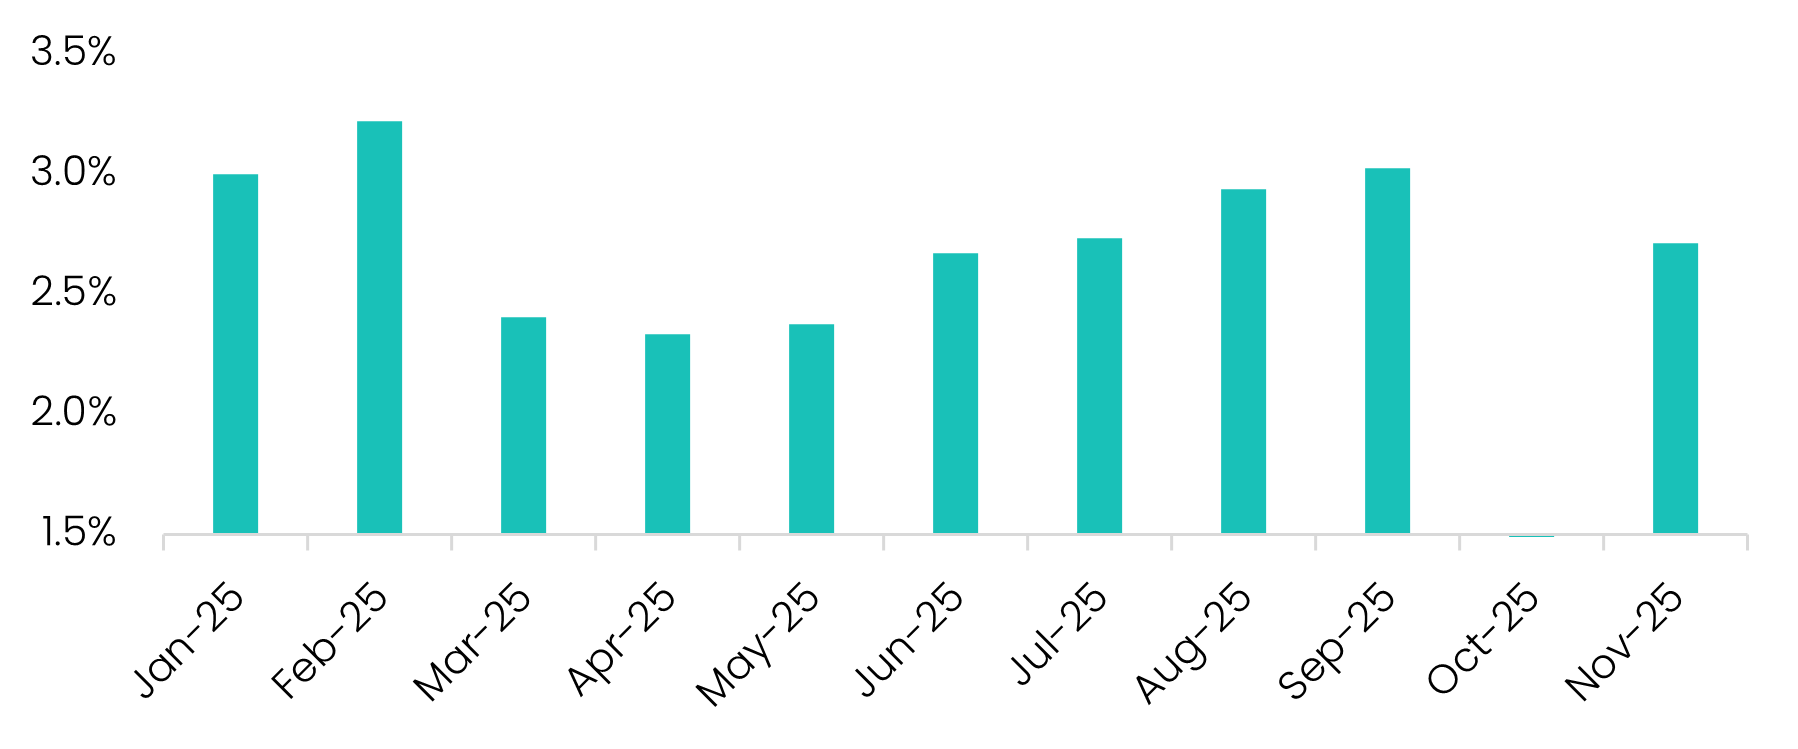
More importantly, the economic damage many feared failed to materialise. US inflation remained broadly contained - hovering in the 2.5–3.0% range, and sitting around 2.7% at the last count. Companies absorbed more of the tariff burden than expected, supply chains adjusted, and ongoing technology-driven productivity gains helped offset cost pressures.
Source: S&P Global, Savana.
For Savana, the episode reinforced three long-held principles: the importance of staying invested through periods of stress, the risks inherent in trying to trade around short-term macro noise, and the enduring robustness of the US economy despite adversity.
By mid-year, markets began to stabilise. The second half of 2025 saw a welcomed V-shaped recovery, as ever-plucky investors managed to shrug off lingering concerns around runaway fiscal deficits, geopolitical tensions and elevated valuations.
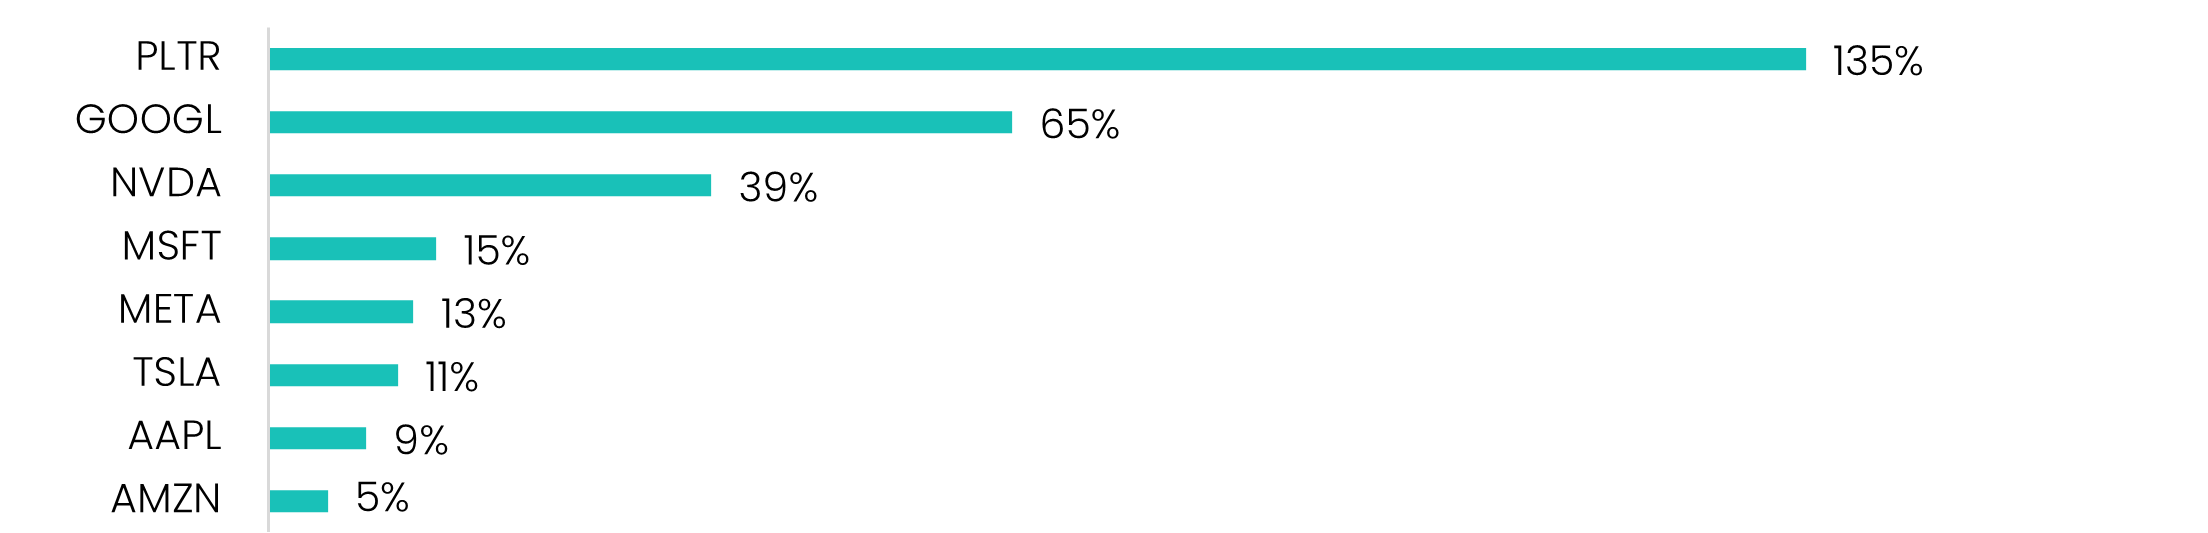
Optimism remained firmly anchored in Big Tech and the AI narrative. Despite slowing earnings growth and persistently stretched valuations, the Magnificent Seven – representing a third of the S&P 500 - collectively climbed a further 23%, led by standout gains in Nvidia (+39%) and Alphabet (+66%).
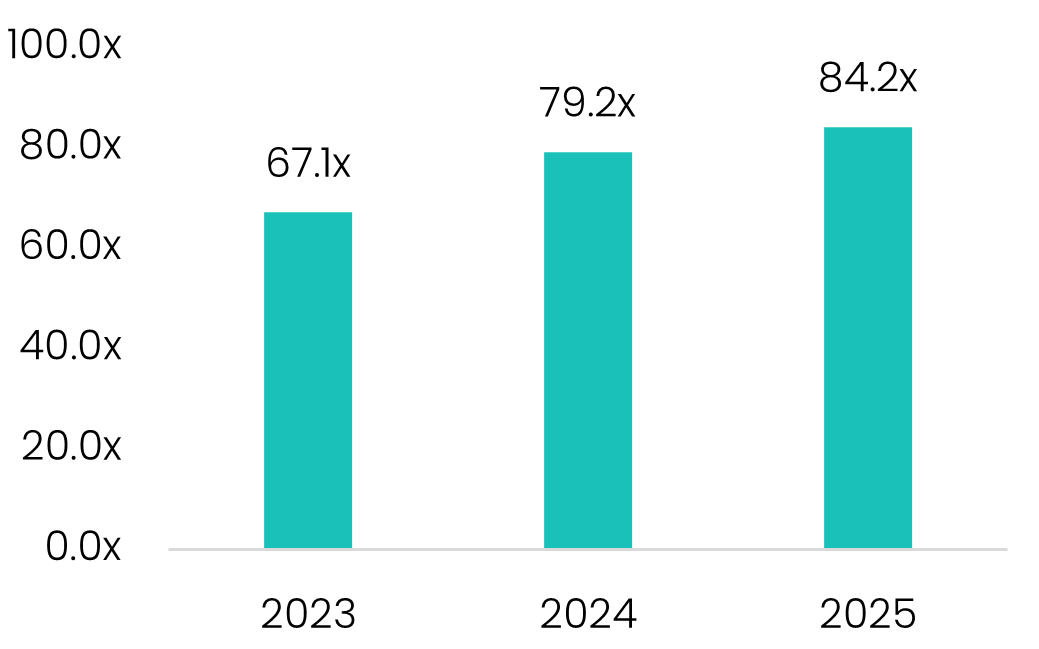
Yet the year’s biggest equity winner was big-data specialist Palantir, which surged 135% on the back of rapid revenue growth and its perceived leadership in applied AI. That rally, however, left Palantir with a less flattering distinction: one of the most expensive stocks in the S&P 500, with investors paying roughly $399 for every dollar of current earnings.
Source: S&P Global, Savana.
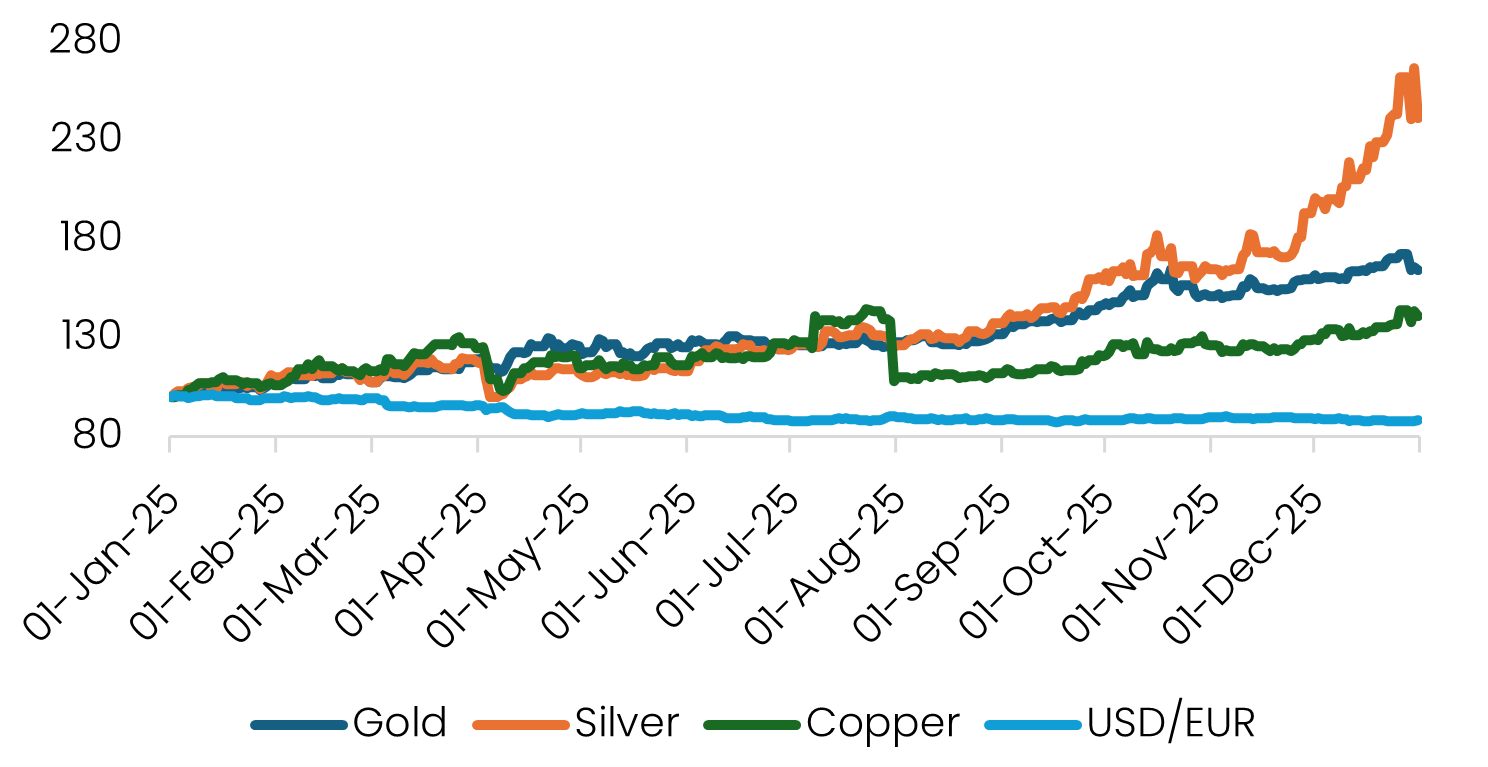
Away from equities, another defining feature of the year was the strong performance of commodities - particularly gold (+64%), silver (+141%) and copper (+41%). Silver and copper benefited from expanding industrial demand linked to renewable infrastructure, semiconductor equipment and defence.
Gold’s continued ascent, meanwhile, was widely viewed as a flight to safety amid inflation concerns, geopolitical conflict and market volatility. It also reflected a quieter structural shift underway. Central banks globally - most notably in China and Russia - continued to reduce their reliance on US dollar reserves by increasing allocations to gold.
This formed part of a broader shift away from US assets over the course of the year, driven by rising protectionism, fading enthusiasm for US exceptionalism and widening interest-rate differentials. The result was a notably weaker US dollar, down around 10% over the year.
Source: S&P Global, Savana.
Closer to home, Australian equity markets also delivered a solid outcome. Of particular note was the renewed strength in the ASX Small Ordinaries Index (+25.0%), which outperformed the ASX 200 for only the second time in eight years.
While some attributed this to rotation away from large-cap defensives, the underlying driver was earnings growth of 34%. The result was powered by a high win rate (67%) and meaningful upside dispersion, with 25 of the 194 companies in the index delivering returns in excess of 100%.
Of those standout performers, 18 were specialist gold or diversified metals companies, while several Aerospace & Defence names also featured prominently - including Electro Optic Systems (+686%), DroneShield (+334%) and Austal (+133%).
Source: S&P Global, Savana.
Markets are never straightforward, but 2025 presented a particularly complex mix of extraordinary and often competing forces:
• Elevated valuations were traded-off against the transformative growth potential of AI.
• Large fiscal deficits helped keep economies moving, but at the cost of upward pressure on inflation and an ever-growing debt burden.
• Monetary policy was caught between competing demands on both sides of the dual mandate.
• Long-held notions of US exceptionalism were challenged by an unconventional and increasingly interventionist administration.
• And geopolitics continued to play a more prominent role, with US–Europe decoupling and a renewed push for national self-sufficiency supporting a shift in capital towards local markets.
For all its complexity, 2025 reinforced a familiar truth: clear strategy and disciplined execution tend to reward long-term investors. Savana’s systematic approach reflects this philosophy, grounded in the belief that attractively valued companies with strong fundamentals will deliver superior outcomes over time.
As for 2026, our only prediction is that elevated uncertainty and volatility are here to stay.
Good luck to all investors.
In a year when investor focus remained heavily tilted toward AI-driven mega-caps and Big Tech narratives, the ASX-listed Savana US Small Caps Active ETF (ASX: SVNP) - systematically targeting undervalued US companies - emerged as the standout performer among US-focused equity ETFs available to local investors. Delivering a calendar year total return of 12.9% net of fees (past performance is not an indicator of future performance), SVNP not only navigated the complexities of tariff volatility and geopolitical shifts but also decisively outperformed a broad array of competing products, including those tracking the most celebrated large-cap indices.
Based on our analysis (as reflected in the chart below), SVNP had the highest total return (net of fees) across all US equity ETFs in Australia in 2025 (excluding leveraged funds, currency-hedged variants, and sector-specific offerings). This achievement is particularly noteworthy given the dominant market story of 2025: the continued ascent of the Magnificent 7 and related AI themes, which propelled benchmarks like the S&P 500, Nasdaq 100, and NYSE FANG+ indices to new all-time highs. Yet SVNP's disciplined focus on mispriced opportunities in the small cap universe allowed it to eclipse these headline-grabbing large-cap trackers, demonstrating the enduring value of looking beyond the consensus crowd.
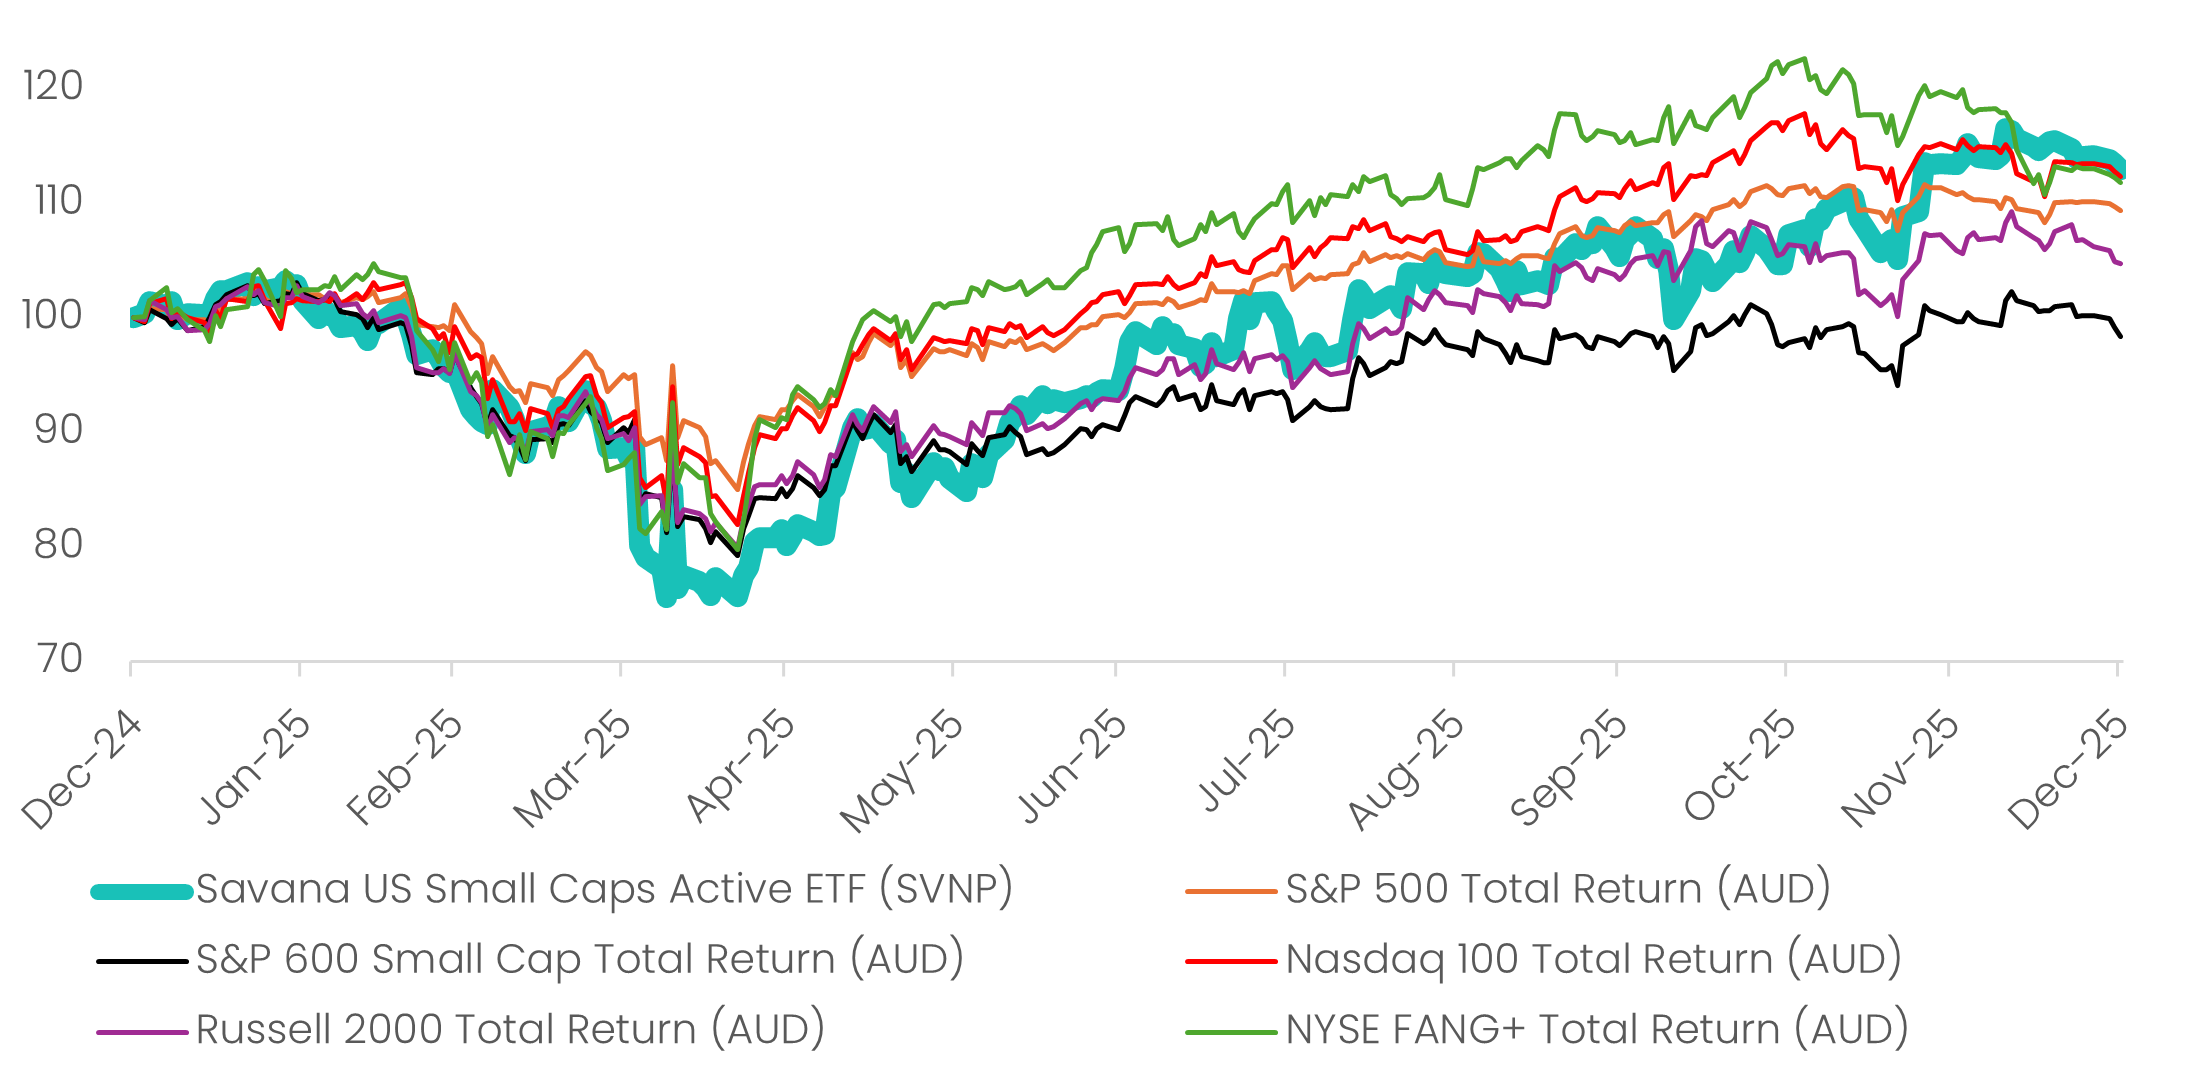
Source: S&P Global, Savana. 1-Year total return performance (net of fees) in AUD of ASX:SVNP versus a range of major US indices, as at 31 December 2025 (rebased at 100). Past performance is not indicative of future performance.
Within the more direct peer group of US small- and mid-cap ETFs, SVNP's edge was even more pronounced. It outperformed established passive offerings such as iShares S&P Small-Cap ETF (ASX: IJR), iShares S&P Mid-Cap ETF (ASX: IJH) and Global X Russell 2000 ETF (ASX: RSSL)1 , reinforcing the advantages of Savana's systematic stock-picking approach over broad indexing in less efficient market segments.
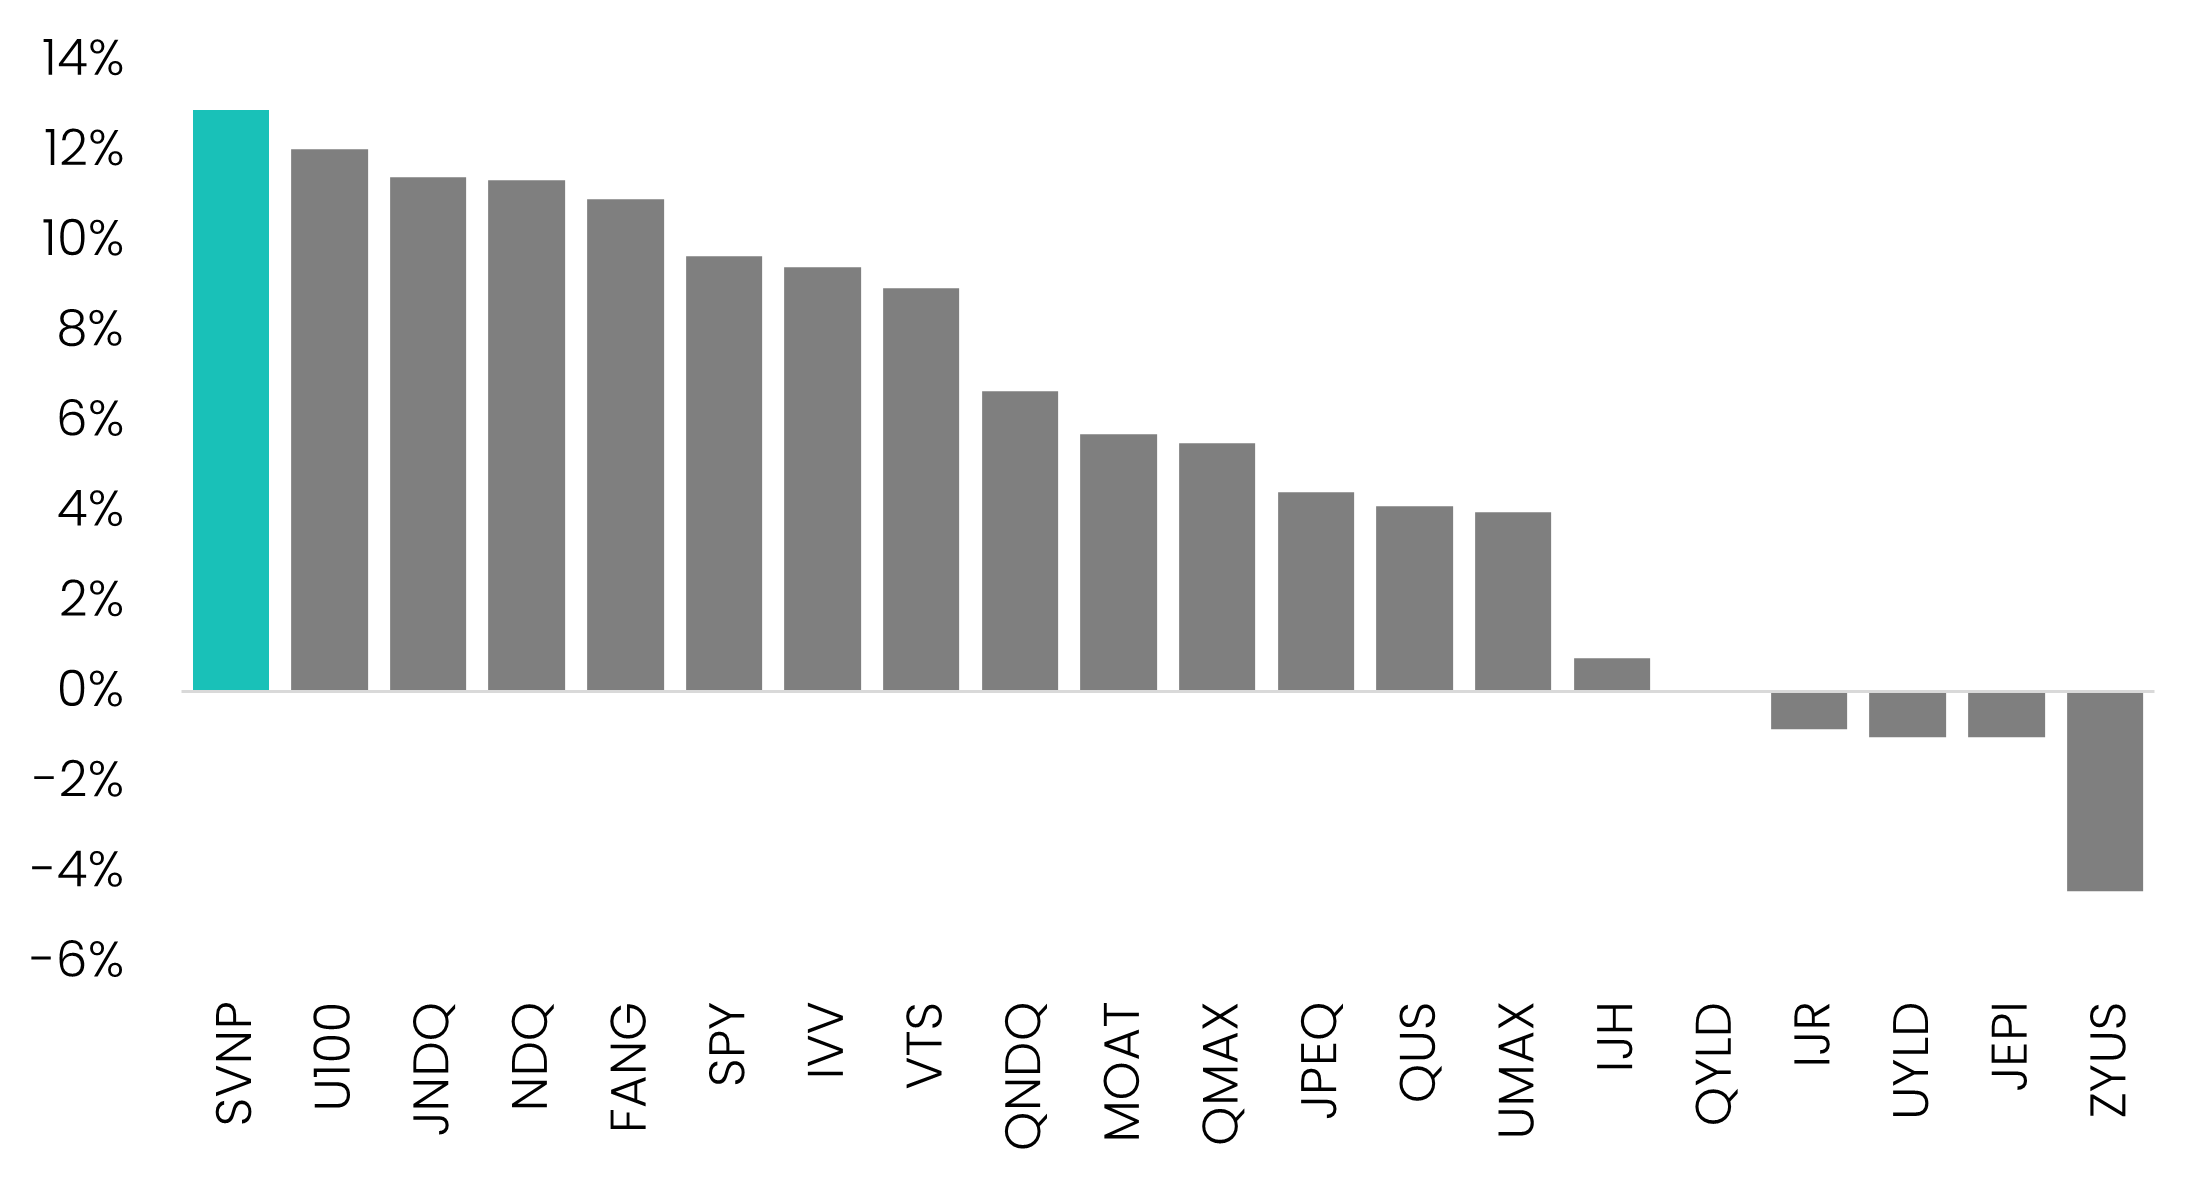
Source: ASX Investment Product – Monthly Update (December 2025, Savana. 1-Year total return (net of fees) of ASX-listed ETFs that hold US equity underlying investments. Excludes leveraged and inverse funds, currency hedged funds, sector-specific funds and funds that were not live over the full period.
On a global stage, SVNP's results hold up impressively amongst the universe of ETFs targeting US small caps. Ranking as the second-best performer when compared to a universe of 112 US-listed small cap ETFs (based on etf.com and S&P Global data), it trailed only the First Trust AlphaDEX US Small Cap ETF (FYC.US) by 2.40% in AUD terms - an achievement that highlights the competitiveness of Savana's methodology on the international stage.
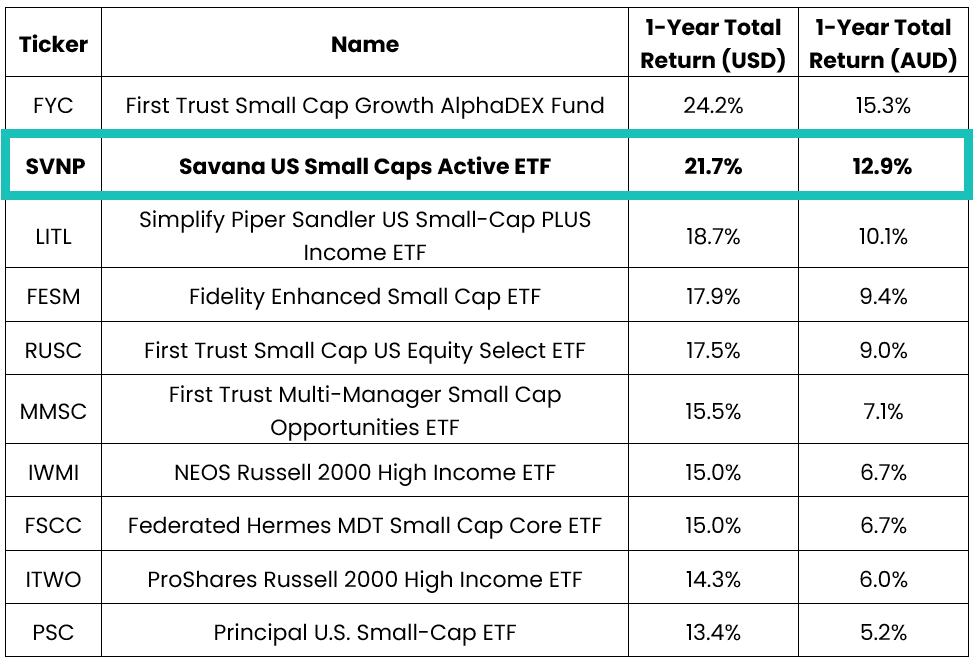
Source: etf.com, S&P Global, Savana. 1-Year total returns (net of fees) as at 31 December 2025 of top performing US-listed small cap ETFs compared to SVNP. Excludes leveraged and inverse funds and funds that were not live over the full period. Past performance is not indicative of future performance.
These relative triumphs underscore the growing reputation of Savana’s technology as a proven engine for uncovering alpha in overlooked corners of the market. While many strategies chased thematic momentum in highly visible large caps, SVNP's broad coverage and systematic algorithms sought out valuation asymmetries and fundamental strength to identify companies poised for sharp re-ratings. In 2025, this translated into a win-rate of over 60% and strong performance even as broader small caps contended with challenging market dynamics.
As uncertainty persists into 2026, SVNP's emerging track record against peers offers a compelling reminder: in complex markets, repeatable processes focused on genuine mis-pricings can deliver differentiated outcomes.
While SVNP had a great 2025, Savana’s approach has much wider applications and we look forward to bringing new opportunities to capitalise on our investment insights to market in the year ahead.
Unlike many active strategies that lean on thematic tilts, sector bets, or hedging overlays, Savana’s approach is grounded simply in pure stock-picking capability. In 2025, we delivered on that approach.
Using simple holding-period close prices (excluding trading impacts and frictional costs), stock selection contributed approximately 24.5% to portfolio returns over the calendar year. This compares with SVNP’s net return of 12.9%, with the difference largely attributable to adverse USD/AUD FX movements (–7.22%) (since SVNP is not currency hedged).
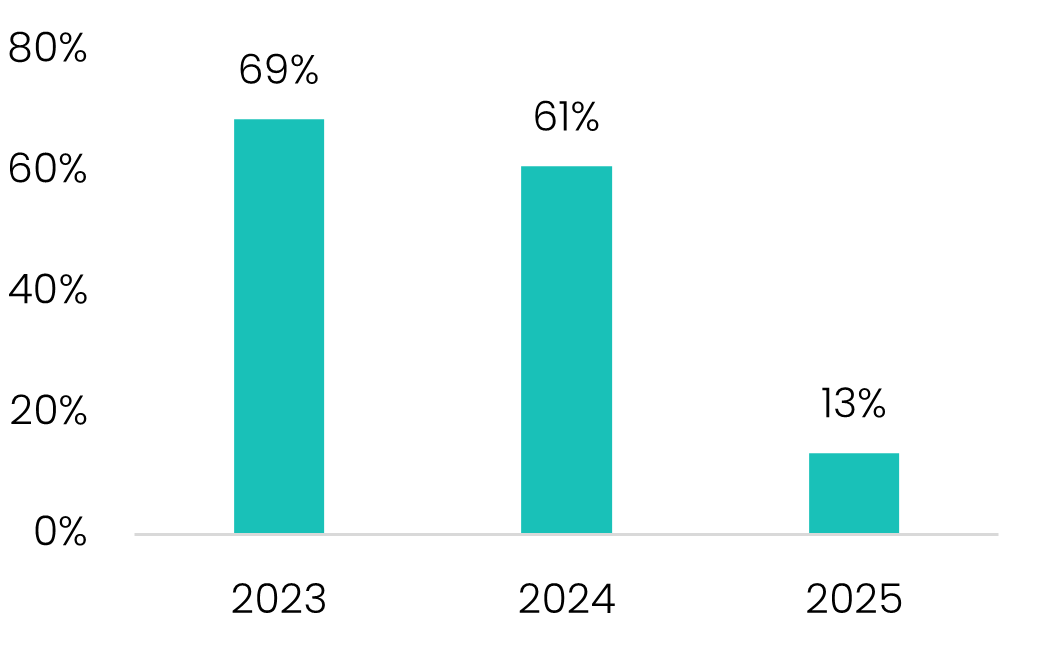
Consistent with the strategy’s historical profile, performance was driven by a high win rate (60%) alongside meaningful upside from the strongest positions. The contribution from the top five winners outweighed that of the bottom five losers by 1.96x, underscoring the asymmetric return profile the strategy seeks to capture.

Source: S&P Global, Savana. As at 31 December 2025. Total returns by company in local currency terms.
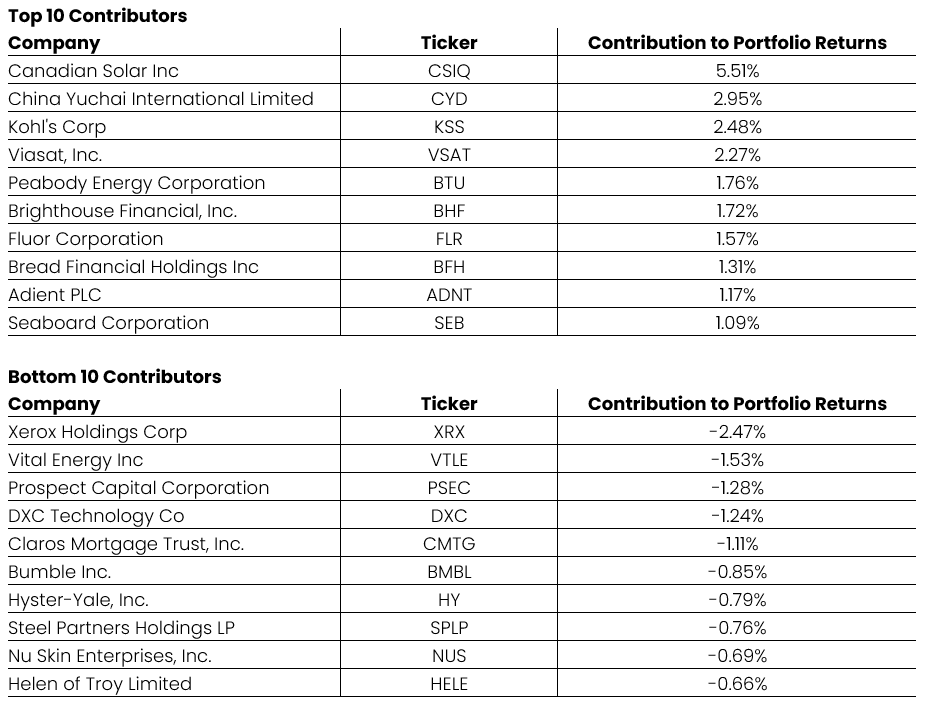
The upside in 2025 was driven by a familiar pattern: deeply out-of-favour stocks re-rating sharply as fundamentals stabilised and expectations reset. The standout contributor was Canadian Solar Inc, which rebounded more than 160% in just two months as sentiment turned following a series of favourable announcements and improving sector data. Kohl's Corp told a similar story. Heavy short-selling pushed the stock well below intrinsic value - trading on just 7.5x earnings, a 5.9% dividend yield, and a real-estate portfolio estimated to exceed book value by up to 4x. Ironically, it was so-called “meme-stock” traders who first recognised the asymmetry, triggering a 38% single-day rally, with subsequent gains underpinned by repeated earnings beats.
Viasat, Inc. delivered a ~60% return in just seven months after the stock bottomed-out in 2024. By early 2025, Viasat was trading at just 0.25x book value, despite resilient underlying cash flows and intact long-term network economics. As operational execution improved and a favourable legal settlement provided an idiosyncratic catalyst, the stock steadily re-rated. Meanwhile, Brighthouse Financial, Inc. represented a textbook valuation dislocation - an “unloved” insurer trading at 0.44x book value before ultimately attracting takeover interest at a 50–60% premium, crystallising value well above Savana’s entry price.
Together, these names highlight Savana’s focus on valuation asymmetry - identifying situations where downside is largely priced in, while even modest fundamental improvement can drive outsized returns.
On the downside, detractors were largely cases where fundamental repair proved slower than expected or sentiment continued to deteriorate, rather than permanent capital impairment. Xerox Holdings Corp and DXC Technology Co struggled amid ongoing structural challenges and scepticism around turnaround execution, while Vital Energy Inc was pressured by commodity price volatility and balance-sheet concerns. Consumer-facing names such as Bumble Inc. and Helen of Troy Limited retreated as growth expectations were reset and competitive dynamics intensified.
Such losses are inevitable in any active strategy. The objective of good portfolio management is therefore not to eliminate losses entirely, but to reduce their frequency and limit their impact. Savana’s strategy is purpose-built to achieve this in a systematic and repeatable way.
By aggregating a diverse set of independent signals, our algorithms apply the principles of the Diversity Prediction Theorem2 to reduce the likelihood of false positives - stocks that appear undervalued but are not. This increases the probability of identifying genuinely mispriced securities, which should, over time, translate into superior investment outcomes.
In 2025, this was reflected in roughly 60% of positions contributing positively to the portfolio, with gains from the strongest winners materially outweighing losses from the weakest detractors. This enhanced decision accuracy, compounded over time, underpins Savana’s long-term performance edge.
1 Savana US Small Caps Active ETF (SVNP) returned 12.91% (net of fees) over the 12-month period ending on 31 December 2025. iShares S&P Small-Cap ETF (IJR) returned -0.81% and iShares S&P Mid-Cap ETF (IJH) returned 0.75% over the same period. Global X Russell 2000 ETF (RSSL) returned 3.2% from inception on 10 February 2025 to 31 December 2025. Over the same period, SVNP returned 13.70% (net of fees). Source: ASX Investment Product – Monthly Update (December 2025), Global X and Savana ETFs.
2 The Diversity Prediction Theorem is a mathematical expression that states that a group's collective prediction error equals the average individual error minus the diversity of predictions. This implies that if you increase prediction diversity, prediction error decreases. In other words, higher diversity of predictions equates to greater accuracy. Source: Page, S. E. (2007). Making the Difference: Applying a Logic of Diversity. Academy of Management Perspectives, 21(4), 6–20.