In these Trumpian times, geopolitics has re-emerged as a central force shaping financial markets. That shift was laid bare in January as attention turned to the Davos Economic Forum, with gold and foreign-exchange markets swinging sharply amid deepening geopolitical fractures. US posturing over Greenland and growing unease about the independence of the Federal Reserve pushed gold to record highs above US$5,100 per ounce, while the dollar slid to a four-year low against a broad basket of currencies.
And yet, for anyone familiar with Trump’s negotiating playbook, the subsequent late-month reversal was scarcely surprising. In his Davos address, Trump defused speculation around military escalation and shortly thereafter flagged the emergence of a “framework” agreement. Then, in the final days of a turbulent month, he nominated Kevin Warsh - widely regarded as both well-credentialed and distinctly hawkish - as the next Federal Reserve chair, easing fears of political interference in monetary policy and helping to trigger the biggest single-day decline in gold since the 1980s.
The episode was emblematic of a broader pattern of five years of Trumpian rule: heightened political noise, but little lasting economic or financial damage. For investors willing to look through the geopolitical malaise, we believe the United States remains by far the most compelling long-term investment destination. Here are the three forces underpinning our bullish view on US equities today:
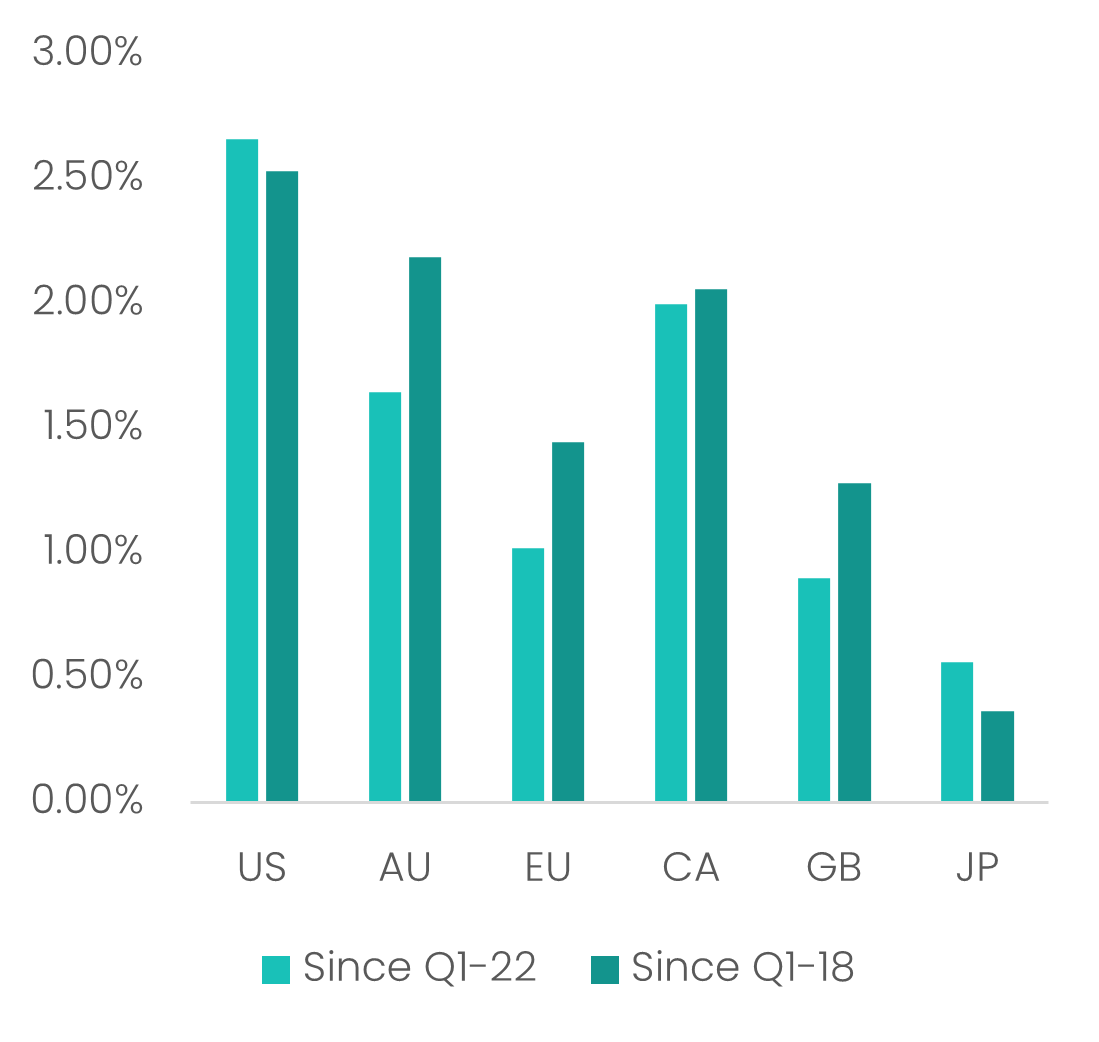
The US continues to outperform most OECD peers on core macroeconomic measures. Recently released Q3-25 US data shows annualised quarter-on-quarter GDP growth of 4.4% alongside a 4.9% surge in labour productivity - both the strongest readings since Q3 2023.
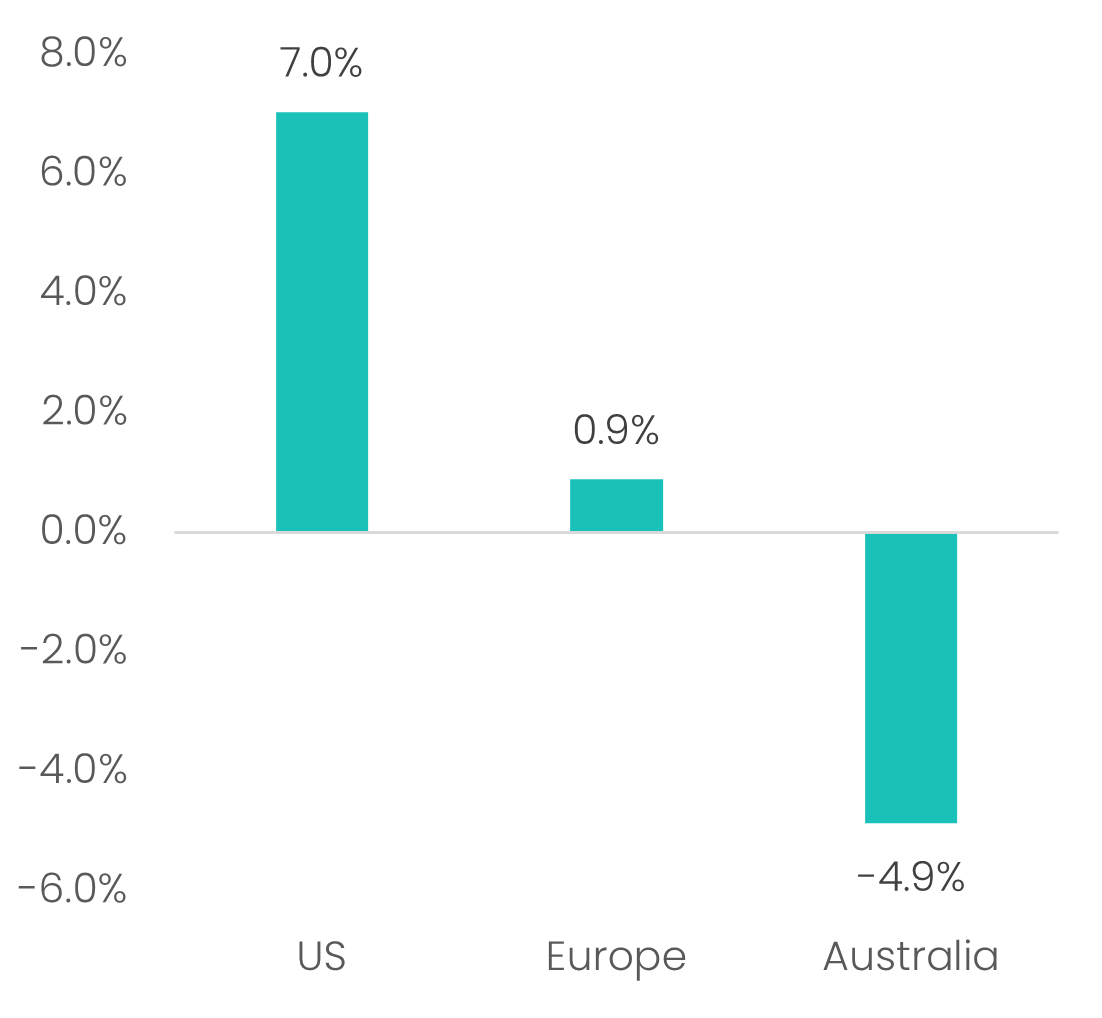
Since the beginning of 2022, U.S. labour productivity has risen by a cumulative 7.0%. Over the same period, Australia’s productivity has declined by 4.9%, while Europe’s has been broadly flat at just 0.9%. This productivity advantage - driven by the U.S.’s innovation-led business culture, more flexible labour markets and structurally lower energy costs - has translated into consistently stronger economic growth over time.
Source: Savana, S&P Global. Average year-on-year GDP growth by quarter up to 30-Sep-25.
Source: Savana, S&P Global. Total productivity growth between Q1-22 to Q3-25.
The United States remains the centre of global innovation and continues to outpace its peers in deploying capital toward the technologies most likely to drive the next wave of productivity and economic growth.
In 2025, U.S. technology leaders - Amazon, Microsoft, Alphabet and Meta - invested a combined A$329 billion in AI infrastructure and related capital expenditure, representing a 66% year-on-year increase (according to data by S&P). This surge in spending is not only expanding the U.S. economy’s long-term productivity frontier; it is also fuelling a broader upswing in activity across construction, utilities and advanced manufacturing. According to S&P Global, data-centre and AI-related investment accounted for roughly 80% of U.S. private domestic-demand growth in the first half of 2025.1
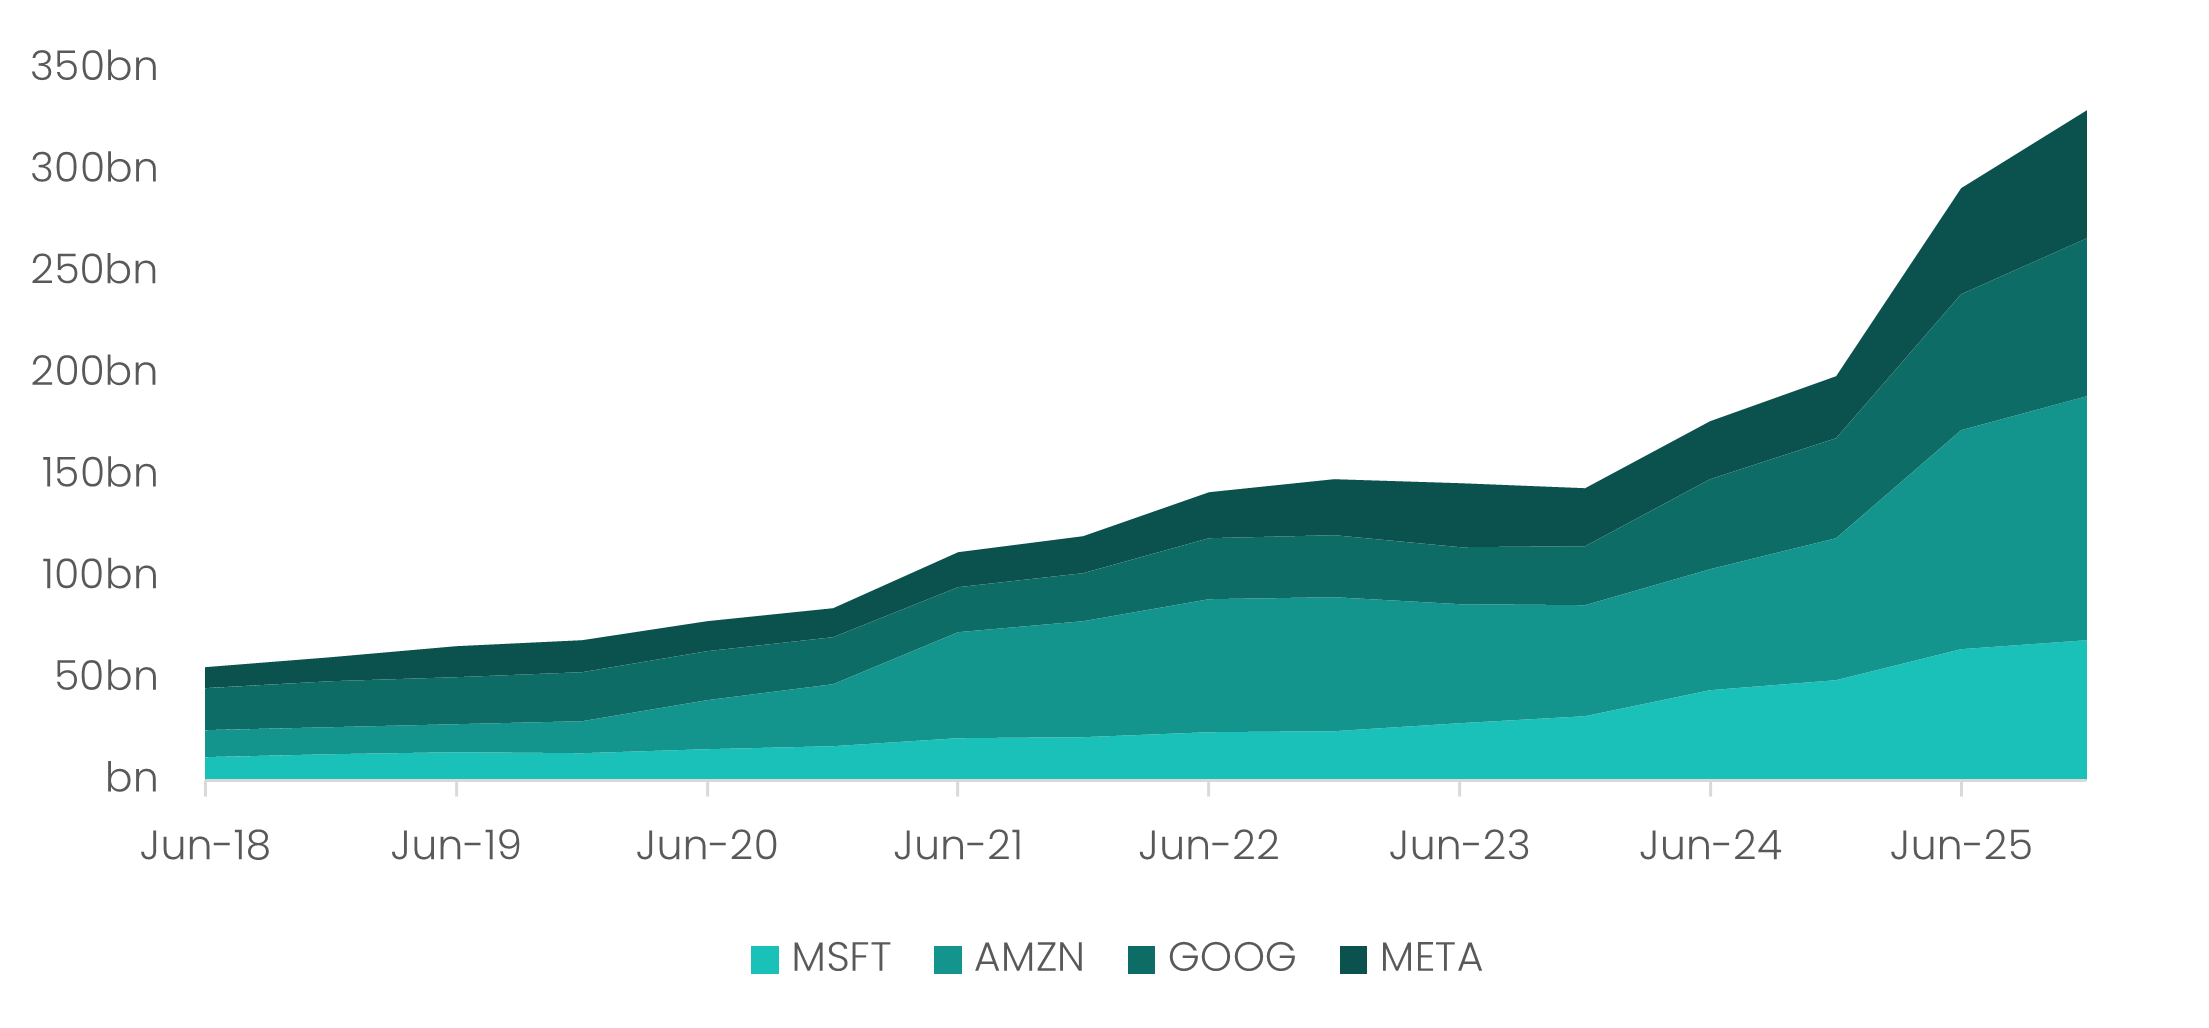
Source: Savana, S&P Global. LTM Capex spend by Company, 30-Jun-18 to 31-Dec-25.
Amidst all the political theatre and gamesmanship, investors often lose sight of the fact that economic prosperity remains the single biggest priority in Trump’s political doctrine, which has culminated in one of the most investor-friendly climates amongst developed markets.
The One Big Beautiful Bill (OBBB) marked one of the largest deregulatory pushes in modern US history, stripping back red tape across high-multiplier sectors such as energy production and infrastructure. One of the most underappreciated features of the OBBB was the reinstatement of 100% bonus depreciation, allowing companies to deduct the entire cost of qualifying investments in the first year, materially lifting the net present value of new projects and incentivising earlier, larger-scale capital deployments. With an already low statutory corporate tax rate of 21%, many analysts argue that the broad range of deductions, credits and allowances facilitate an effective tax rate that is closer to 10%.
Combined with anticipated monetary policy easing and persistently elevated fiscal spending, these measures may form a ‘perfect storm’ for risk assets to accelerate in 2026.
As our local Australian market stares down the barrel of declining corporate profits, sticky inflation and the prospect of further rate rises, the US offers a powerful alternative as the world’s centre for growth and innovation. With the Australian dollar sitting near three-year highs against the greenback, this may provide a favourable window for investors to gain exposure to the world’s most dynamic equity market.
In March 2025, we initiated a position in A-Mark Precious Metals (NASDAQ: AMRK), a distributor and solutions provider in precious metals.
From 7 March to 2 December, the company’s share price climbed 7.63%. A solid return. But from 2 December through to 30 January 2026, the stock surged an impressive 74%.
So… what changed?
In the neat world of financial theory, share price performance is tethered exclusively to realised and expected financial outcomes. But in the real world of financial markets, cosmetics matter - and A-Mark is proof.
On the 2nd of December, A-Mark Precious Metals changed its name to Gold.Com, switched its trading exchange from the NASDAQ to the NYSE, and assumed a new ticker symbol, “GOLD”. The revised corporate identity was accompanied by a rebranding overhaul, including a slick new corporate website. In the company’s own words from their public press release:
“The website showcases a clean, modern aesthetic, highlighted by refined typography, elevated product imagery, and a streamlined layout designed to reinforce Gold.com’s refreshed corporate identity.”2
These aesthetic adjustments proved a masterstroke - particularly against the backdrop of a powerful rally in the physical gold price. To be clear, as a gold trader, Gold.com does not directly benefit from a rising gold price (though it may benefit indirectly through wider buy–sell spreads). In the twelve months prior to its rebrand, Gold.com’s share price exhibited virtually no relationship with gold, with a correlation of just -0.14. Since changing its ticker to “GOLD,” the correlation has surged to a 0.92. In addition to the 74% price increase, the average daily value traded has also risen from US$5.2m to US$20.1m.
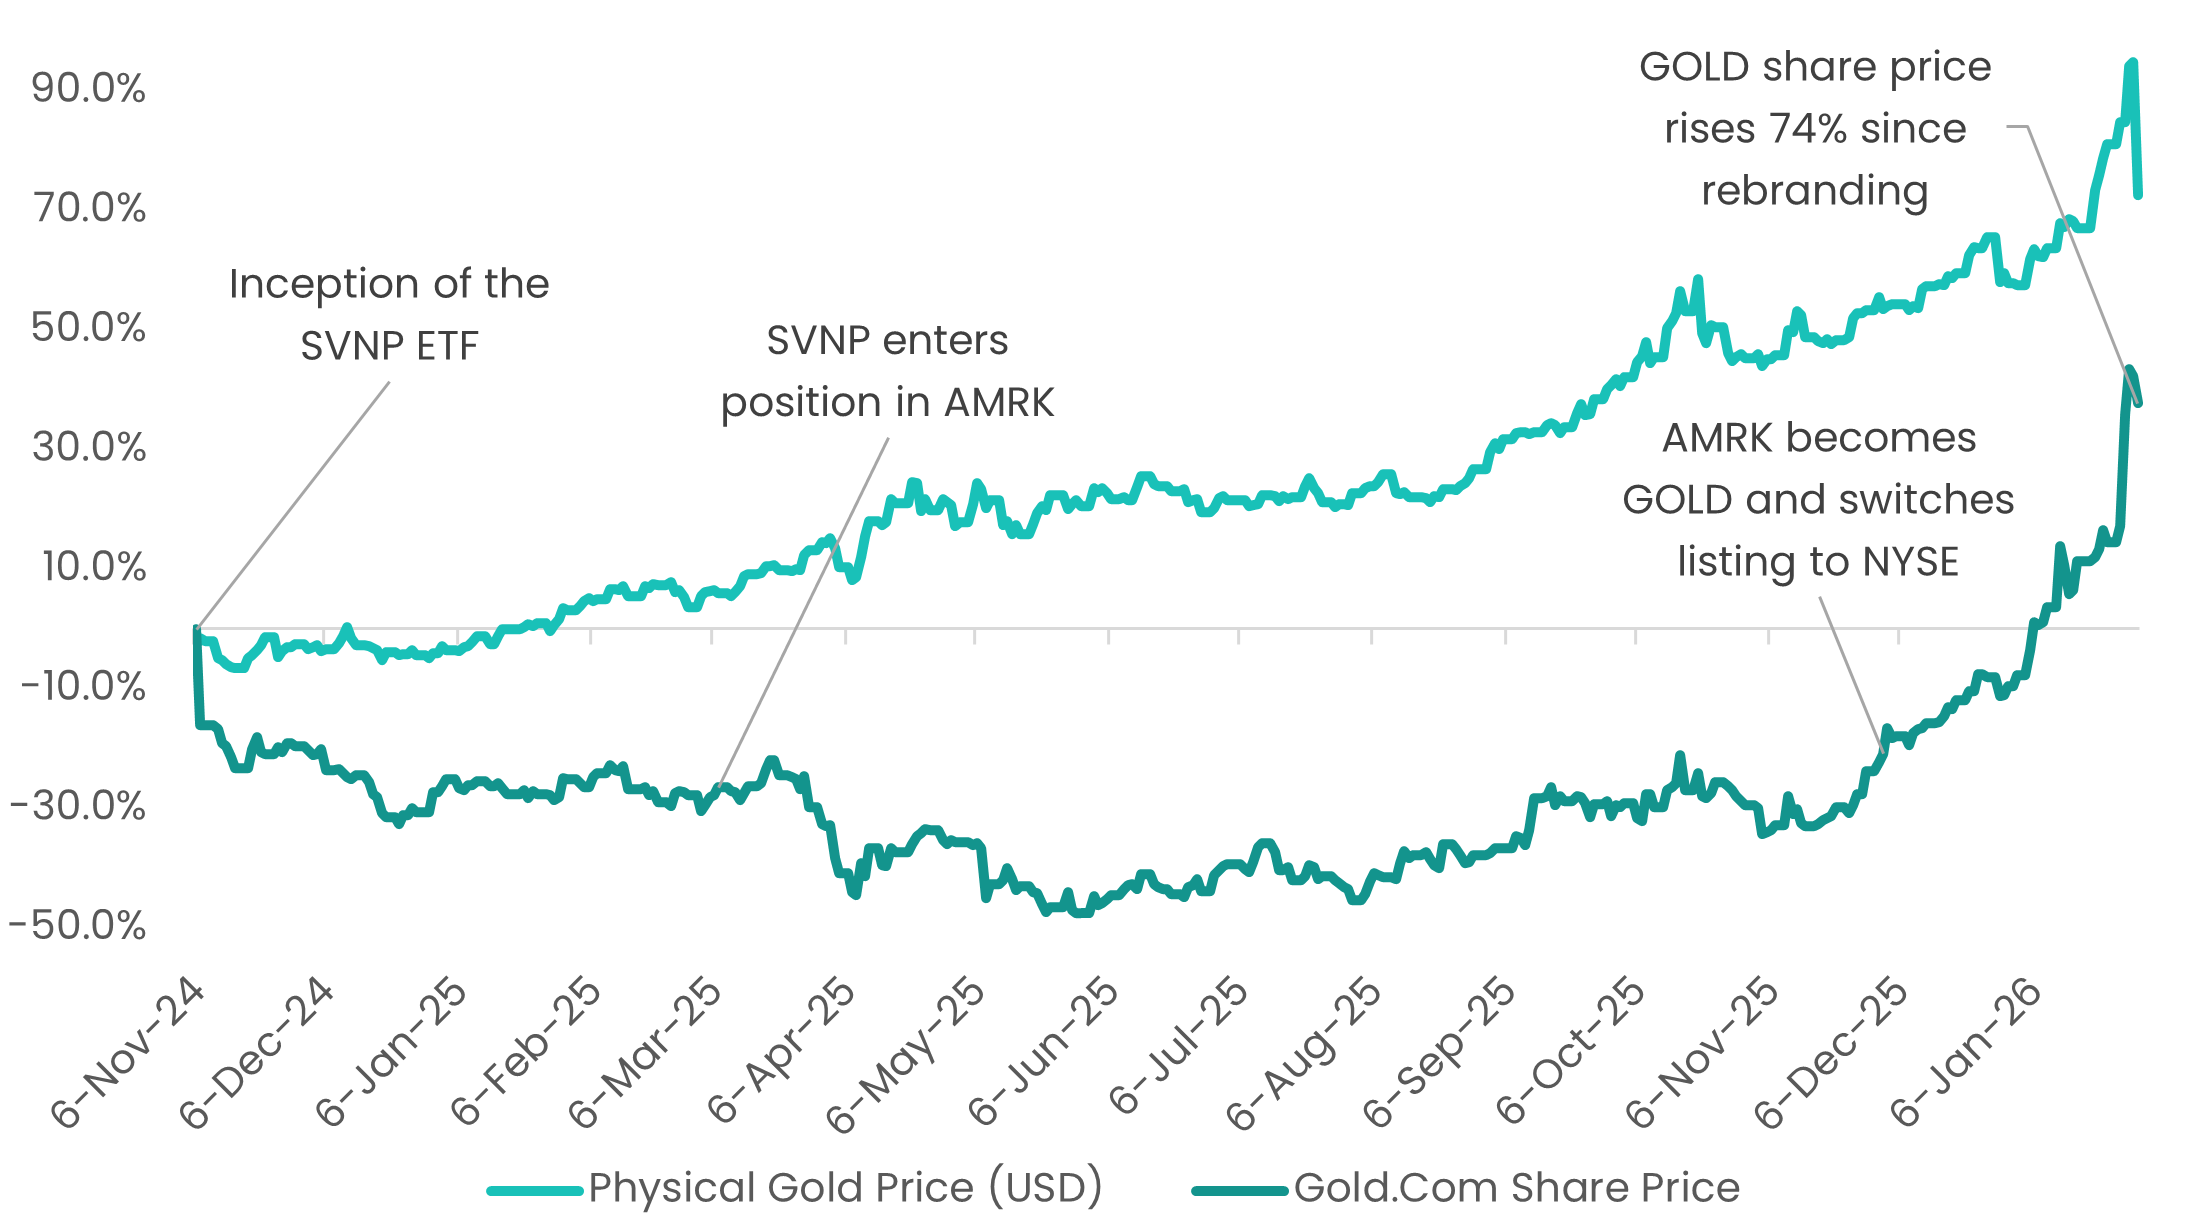
Source: Savana, S&P Global. Physical gold price (USD) returns and Gold.Com share price returns from 6 November 2024 to 31 January 2026.
The Gold.com episode is a striking case study in how optics and branding can shape investor behaviour. Two companies, identical in substance - yet seemingly priced by the market in fundamentally different ways.
For Savana, Gold.com represents another powerful validation of our investment strategy. Our data-driven investment process is designed to analyse stocks objectively, regardless of cosmetic appearance. We believe this discipline allows us to uncover value where others do not, and to position in companies the broader market overlooks. That way, when market perception finally turns - as it did in the case of Gold.com - Savana is positioned to benefit.
In our latest January Fact Sheet, we were pleased to highlight two key performance indicators that speak directly to the quality and consistency of SVNP’s performance.
Firstly, since inception SVNP has delivered an Information Ratio of 1.25. The Information Ratio (IR) is a measure of a portfolio’s risk-adjusted returns relative to a benchmark. It is calculated as the excess return over the benchmark divided by the tracking error (the volatility of the excess return). It reflects not just how much a portfolio outperforms, but how it outperforms relative to the risk taken. According to Investopedia, an IR of greater than 0.5 is considered “good”, while anything over 1.0 is “excellent”.3
The second observation of note is the fact that SVNP has outperformed its benchmark across all reported time periods (1 month, 3-month, 6-month, year-to-date, 1-year, 2024, 2025, and 2026). This is known as “batting average” - the proportion of measured periods in which a strategy outperforms its benchmark.
As shown in the table below, SVNP is currently batting at an average of 100%.

Source: Savana, S&P Global. Total returns are calculated in Australian dollars based on the close-of-day net asset value per unit. Returns are after fees and costs with dividends reinvested. Past performance is not indicative of future performance.
Together, a high Information Ratio and strong batting average portray a strategy that not only has the potential to deliver excess returns, but we believe does so consistently and with disciplined risk-adjusted execution - a combination that we believe is central to long-term investment success.
1 S&P Global, Look Forward: Data Center Frontiers (Dec. 2, 2025)
2 Company press release, “Gold.com to Begin Trading on the New YorkStock Exchange Under Ticker Symbol “GOLD””, 2 December 2025, https://ir.gold.com/news-events/press-releases/detail/212/gold-com-to-begin-trading-on-the-new-york-stock-exchange-under-ticker-symbol-gold
3 “Information Ratio,” Investopedia, https://www.investopedia.com/terms/i/informationratio.asp