In August, SVNP returned -0.09%, outperforming the S&P Small Cap 600 Index by +2.49%.
The flat portfolio result largely reflected a +2.31% stock-level portfolio contribution, offset by a -1.99% movement in the USD/AUD exchange rate. Underlying stock performance was broad-based: of the portfolio’s 30 holdings, 11 delivered double-digit returns and 16 finished the month higher. Key contributors included BitGo (+46.5%), ZoomInfo (+28.5%) and ManpowerGroup (+20.1%). Key detractors included PicS N.V. (-19.6%), China Yuchei (-18.7%) and Canadian Solar (-18.2%).
August marked the sixth consecutive instance where SVNP has outperformed the Benchmark in a down month. This defensiveness is reflected in our Capture Ratios; on average since inception, SVNP has outperformed by +1.29% in months where the Benchmark has fallen. We believe this reflects an important feature of our approach: systematically investing in companies that are undervalued and oversold can create natural price support, contributing to greater downside resilience and a more favourable overall risk-reward dynamic.
We believe markets are entering a testing phase. Long-term bond yields remain near multi-decade highs and sovereign debt burdens across developed markets are attracting increasing scrutiny. The AI trade is also evolving. While August saw a partial recovery across AI-related stocks following a sharp sell-off in July, in our view the overall trend is suggestive of a maturing trade - one in which investors are becoming more discriminating and less willing to reward thematic exposure alone. That raises the hurdle for further market upside.
Against this backdrop, we believe small caps remain an attractive source of opportunity, trading at around a 25% valuation discount to large caps. However, following a 23.9% rally in the first half of the year, the next leg will increasingly depend on earnings delivery rather than further re-rating.
In a more challenging market, idiosyncratic stock selection becomes increasingly important. We believe Savana's high-conviction, systematic approach is well placed to identify those opportunities.
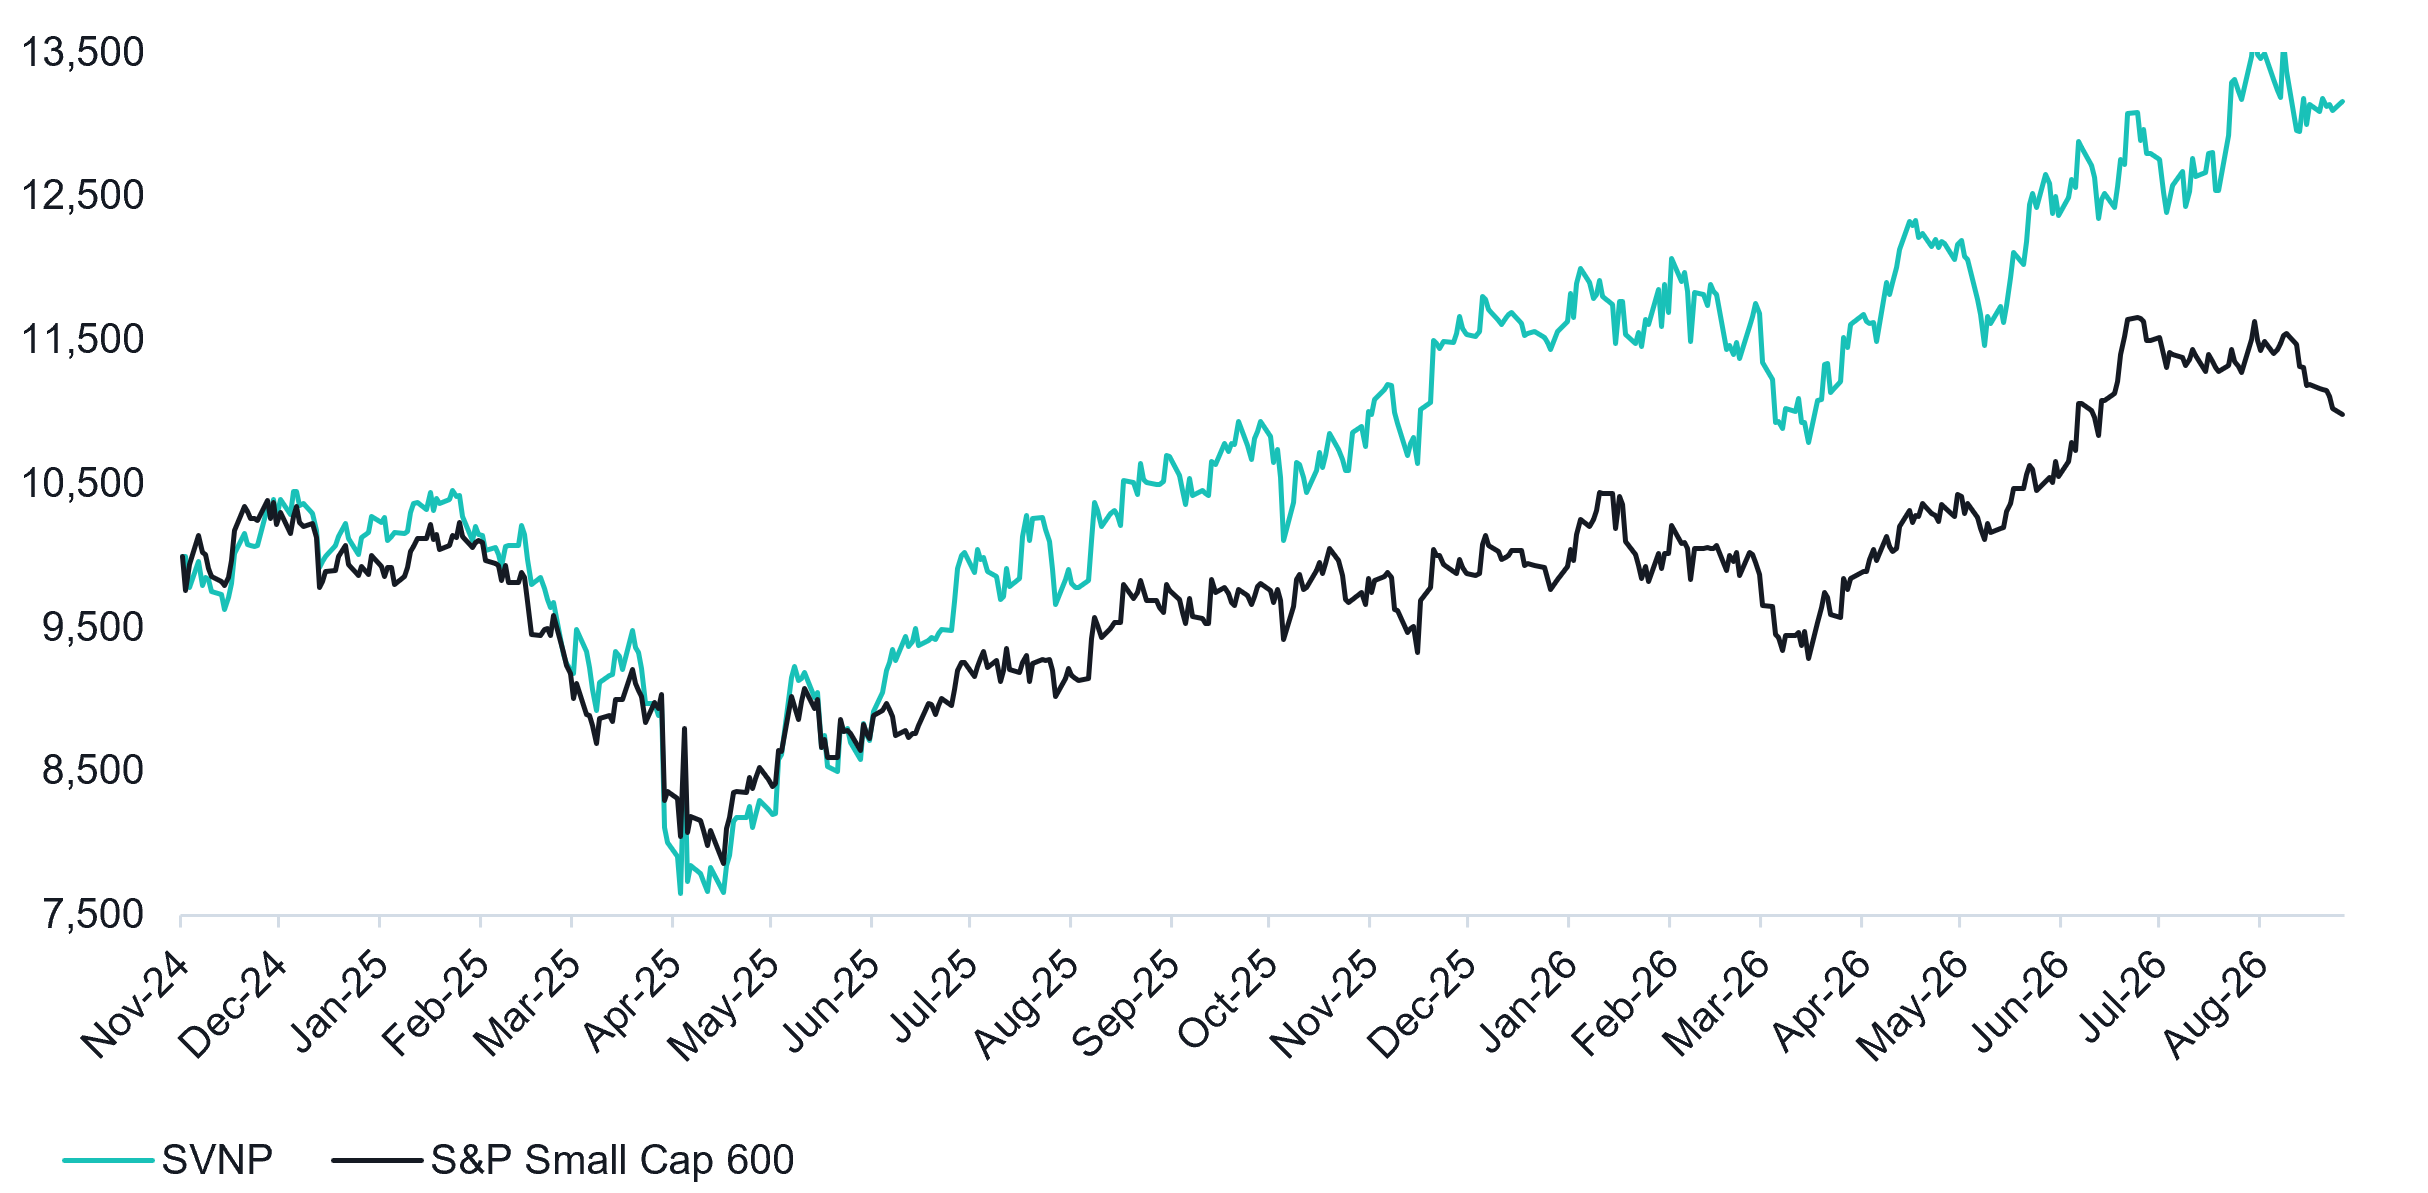
Source: S&P Global, Savana. Value of a hypothetical A$10,000 investment in SVNP since inception on 6 November 2024, based on close-of-day net asset value per unit, as at 31 August 2026. Returns are after fees and costs with dividends reinvested. Past performance is not indicative of future performance.
Source: S&P Global, Savana. As at 31 August 2026. The Savana US Small Caps strategy was implemented on the ASX as of the 6th of November 2024. Total returns are calculated in Australian dollars based on the close-of-day net asset value per unit as at the last day of the given period. Returns are after fees and costs with dividends reinvested. Returns for periods greater than one year are annualised. ‘Relative’ figures are the arithmetic difference between the SVNP and benchmark returns shown; the ‘Since Inception’ relative figure is therefore a per-annum differential. Past performance is not indicative of future performance.
Source: S&P Global, Savana as at 31 August 2026.
August gave investors plenty to think about.
The AI trade stabilised after July's sharp reversal. Software stocks staged a significant recovery. At the same time, pressure returned to global bond markets as investors confronted persistent inflation, rising government debt and, increasingly, competition for capital from the AI investment boom itself.
Taken together, we think these developments point to a market that is becoming more discerning - and one in which company fundamentals may matter increasingly.
One feature of the AI boom has been the speed at which market expectations have moved relative to the underlying evidence. August offered some early signs that this may be changing. Another earnings season gave investors more information on the strength of AI demand, the scale of investment still required and whether that investment is beginning to generate an economic return.
The results were broadly reassuring. Microsoft reported Azure growth of 43%, Amazon's AWS grew 37% against 31% expected, and Nvidia reported quarterly revenue of US$96.2bn, up 106% year-on-year. At the same time, the scale of investment became clearer: Amazon lifted expected 2026 capital expenditure to US$220bn, while Alphabet raised its forecast to US$195-205bn.
The market response increasingly reflected both sides of that equation - rewarding evidence of strong demand and capacity constraints, while becoming more sensitive to the cost and prospective return on that spending.
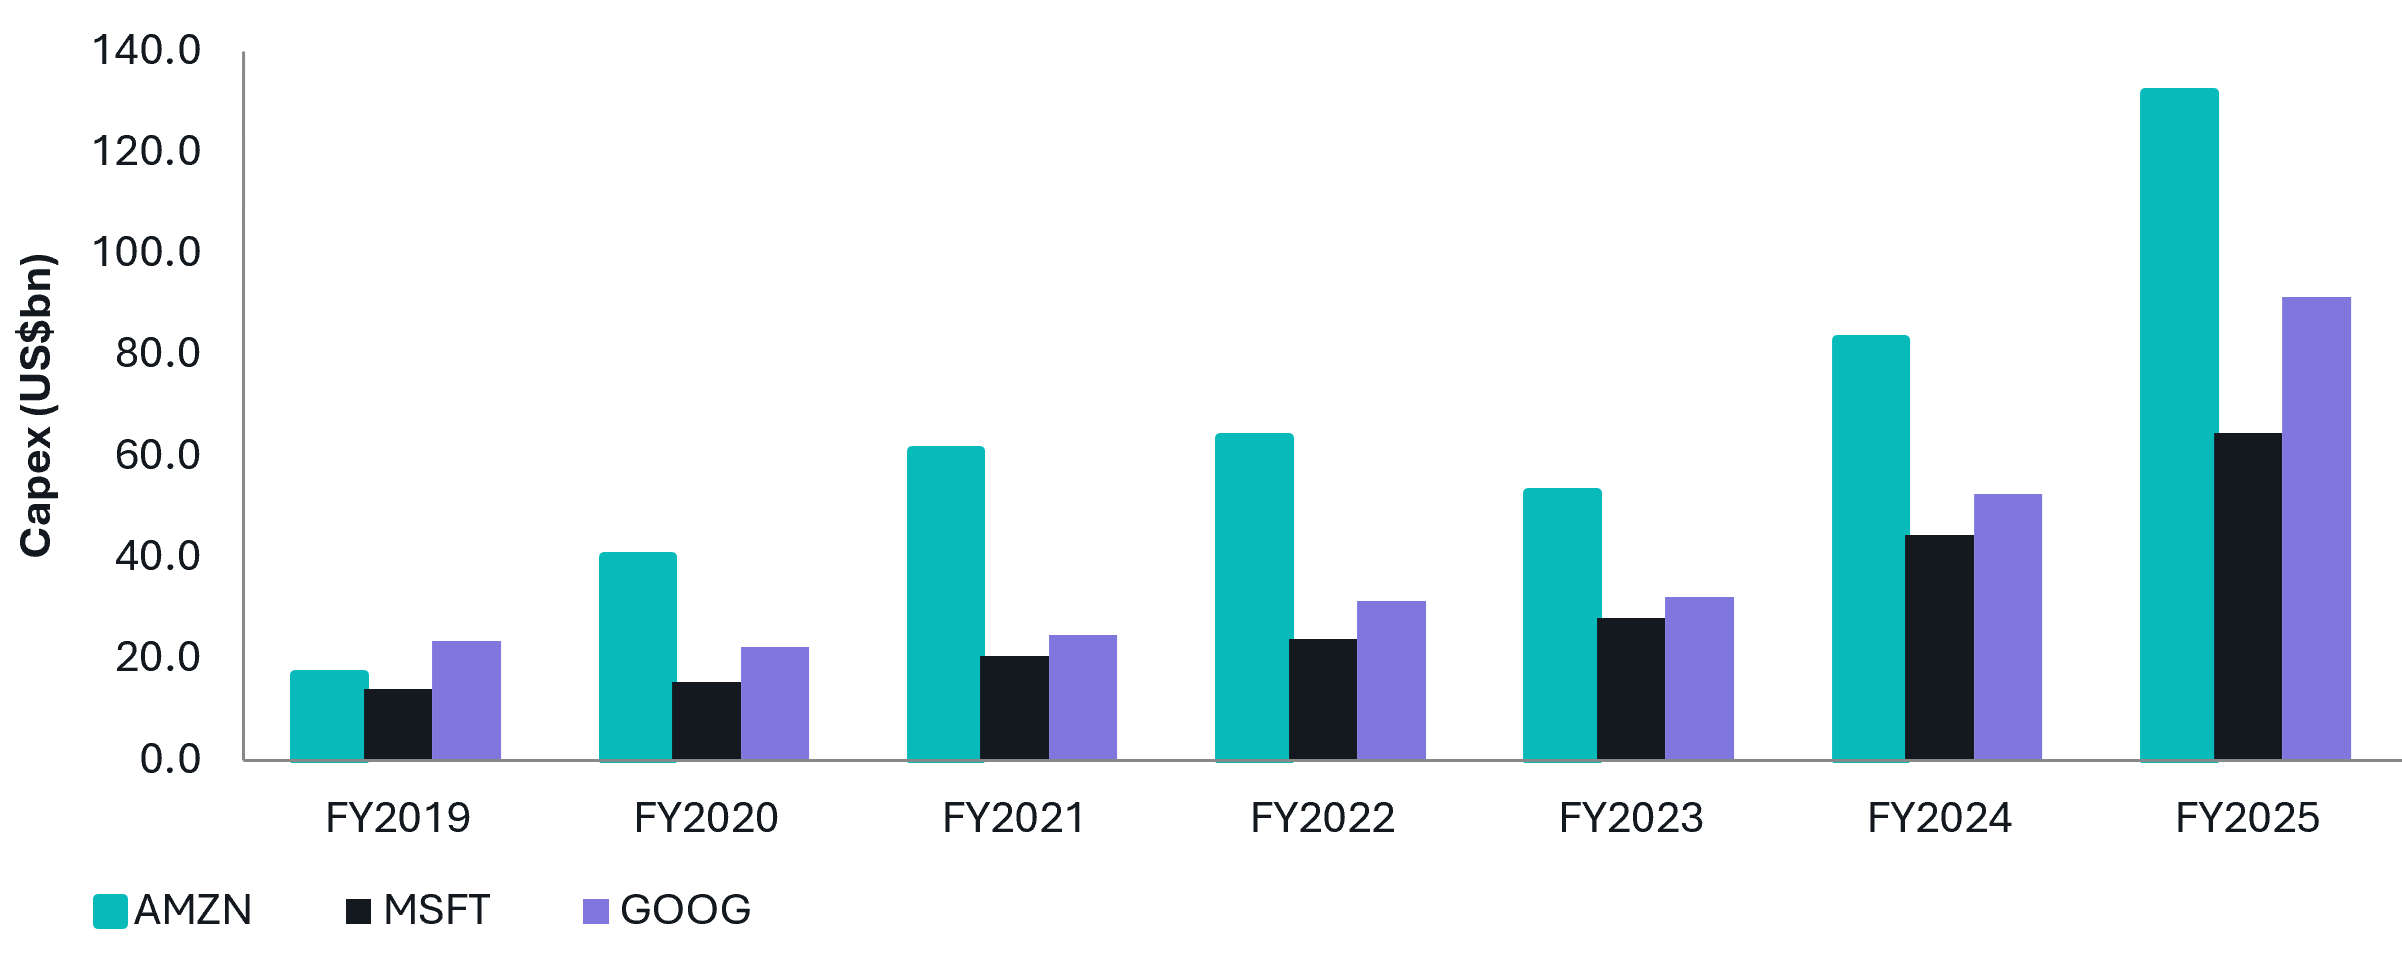
Source: S&P Global, Savana. Annual capital expenditure for Amazon, Microsoft and Alphabet in US dollars, FY2019 to FY2025.
That greater discrimination was also visible beyond the hyperscalers. Chip-related companies that had been heavily sold down in July stabilised: Sandisk fell 46.6% in July before recovering 29.0% in August, while Micron fell 28.7% and then recovered 16.5%. Software rebounded even more strongly, with the iShares Expanded Tech-Software ETF gaining 16% and Atlassian rising 92%.
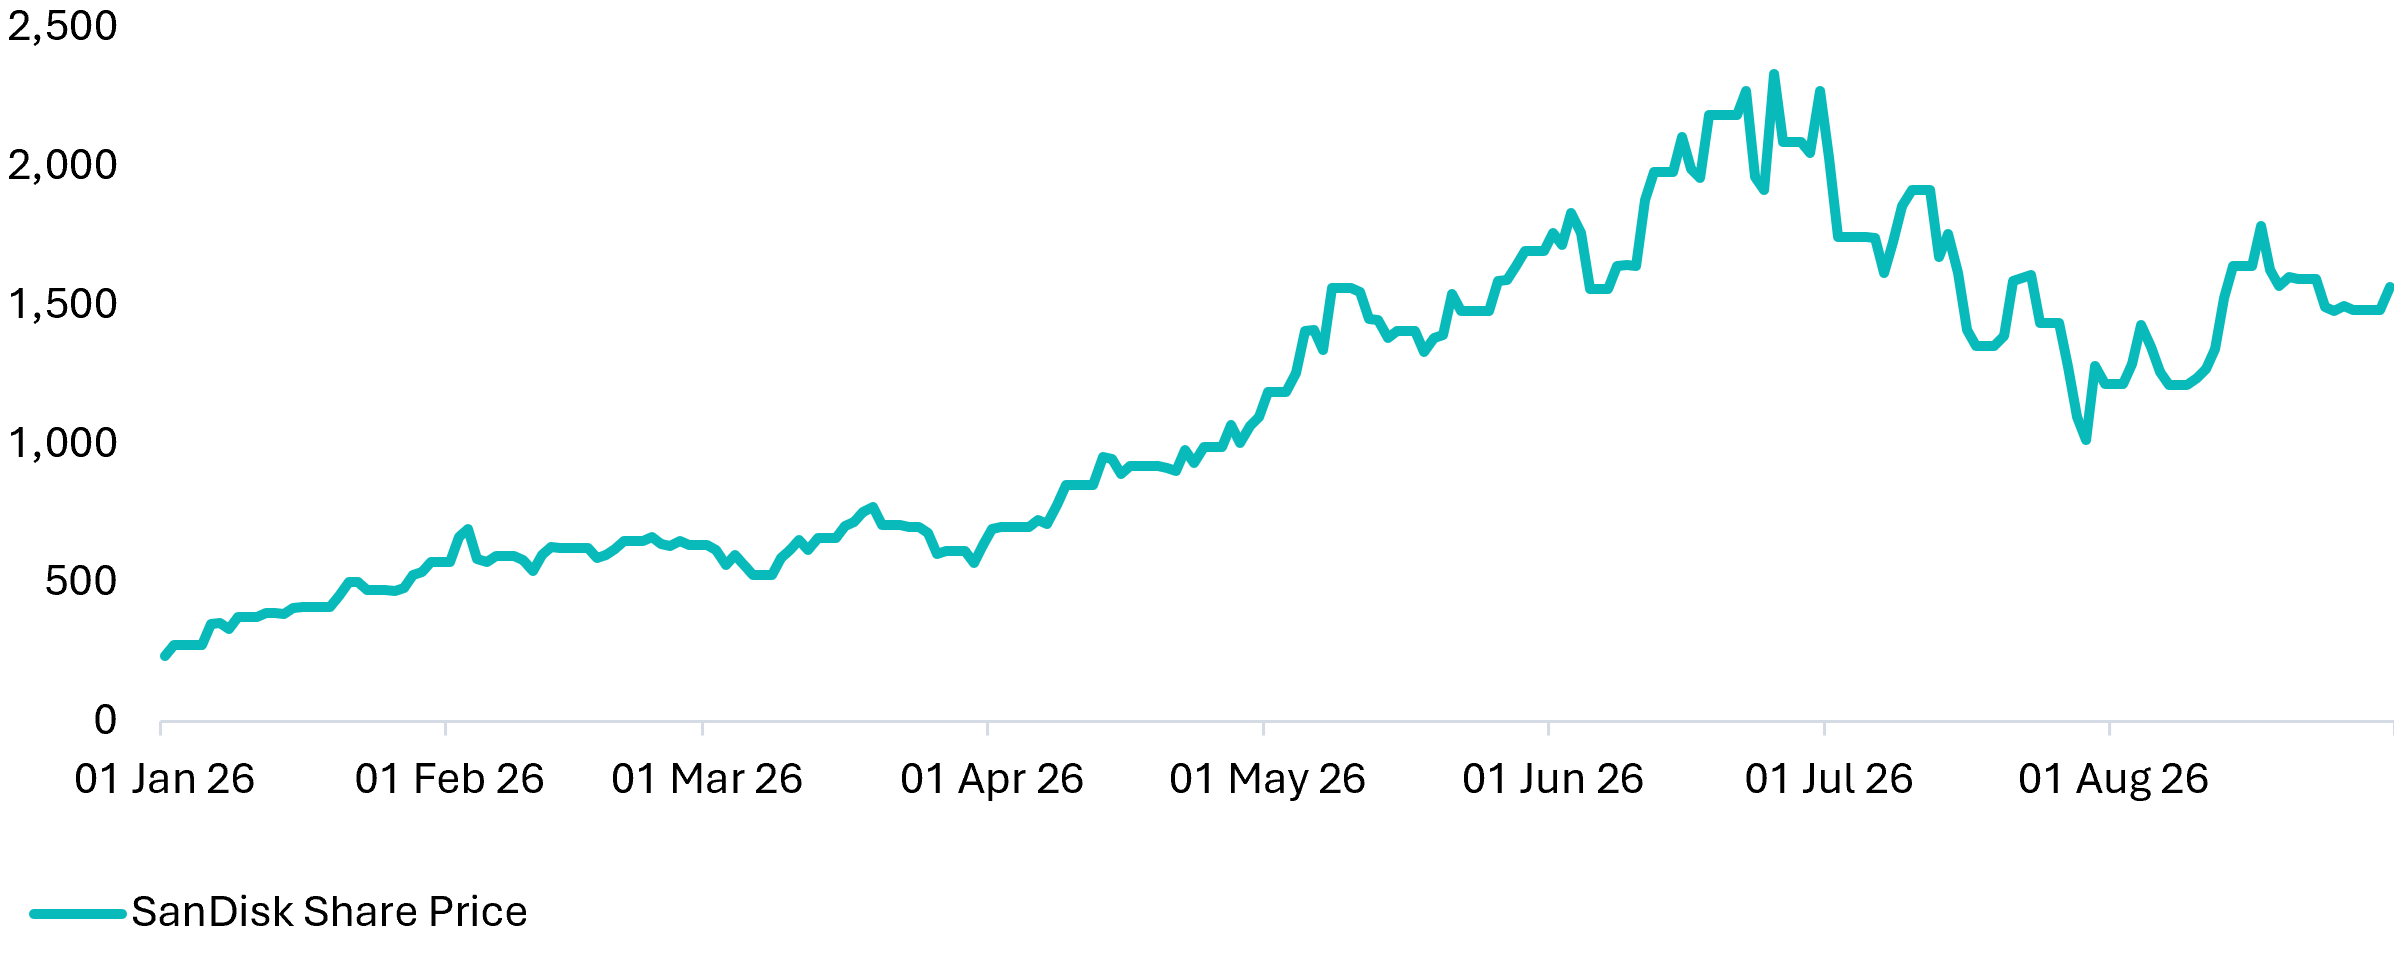
Source: S&P Global, Savana. Daily close price for SanDisk Corporation, 1 January 2026 to 31 August 2026.
Atlassian's results helped explain the move. Revenue increased 28%, cloud revenue 31% and remaining performance obligations 44%, while AI-assisted actions through Rovo grew more than 50% quarter-on-quarter. This provided further evidence that established software businesses with embedded workflows, proprietary data and entrenched customer relationships may be able to incorporate AI into their platforms rather than be displaced by it.
Taken together, we believe that August may therefore represent an early stage in the maturation of the AI trade. Earnings are beginning to replace conjecture with evidence - which companies are seeing genuine demand, where large-scale capital expenditure is producing measurable growth, and which existing business models are proving more resilient than initially feared. This does not mean the volatility is over - expectations remain high and the eventual return on AI investment remains uncertain - but it does suggest that the market is becoming better equipped to price those risks and opportunities on their individual merits.
August also brought renewed pressure in global bond markets. In the US, the 30-year Treasury yield reached 5.34% on 19 August - its highest level since 2007 - before the Treasury doubled the size of its long-dated bond buybacks in an effort to improve market liquidity. Japan's 10-year government bond yield approached 3% for the first time since 1996. By early September, the same sell-off had pushed Germany's 10-year yield to its highest level since 2011 and the equivalent UK gilt yield to its highest since 2008. The Australian bond yield closed at 5.08% - the highest in 15 years.
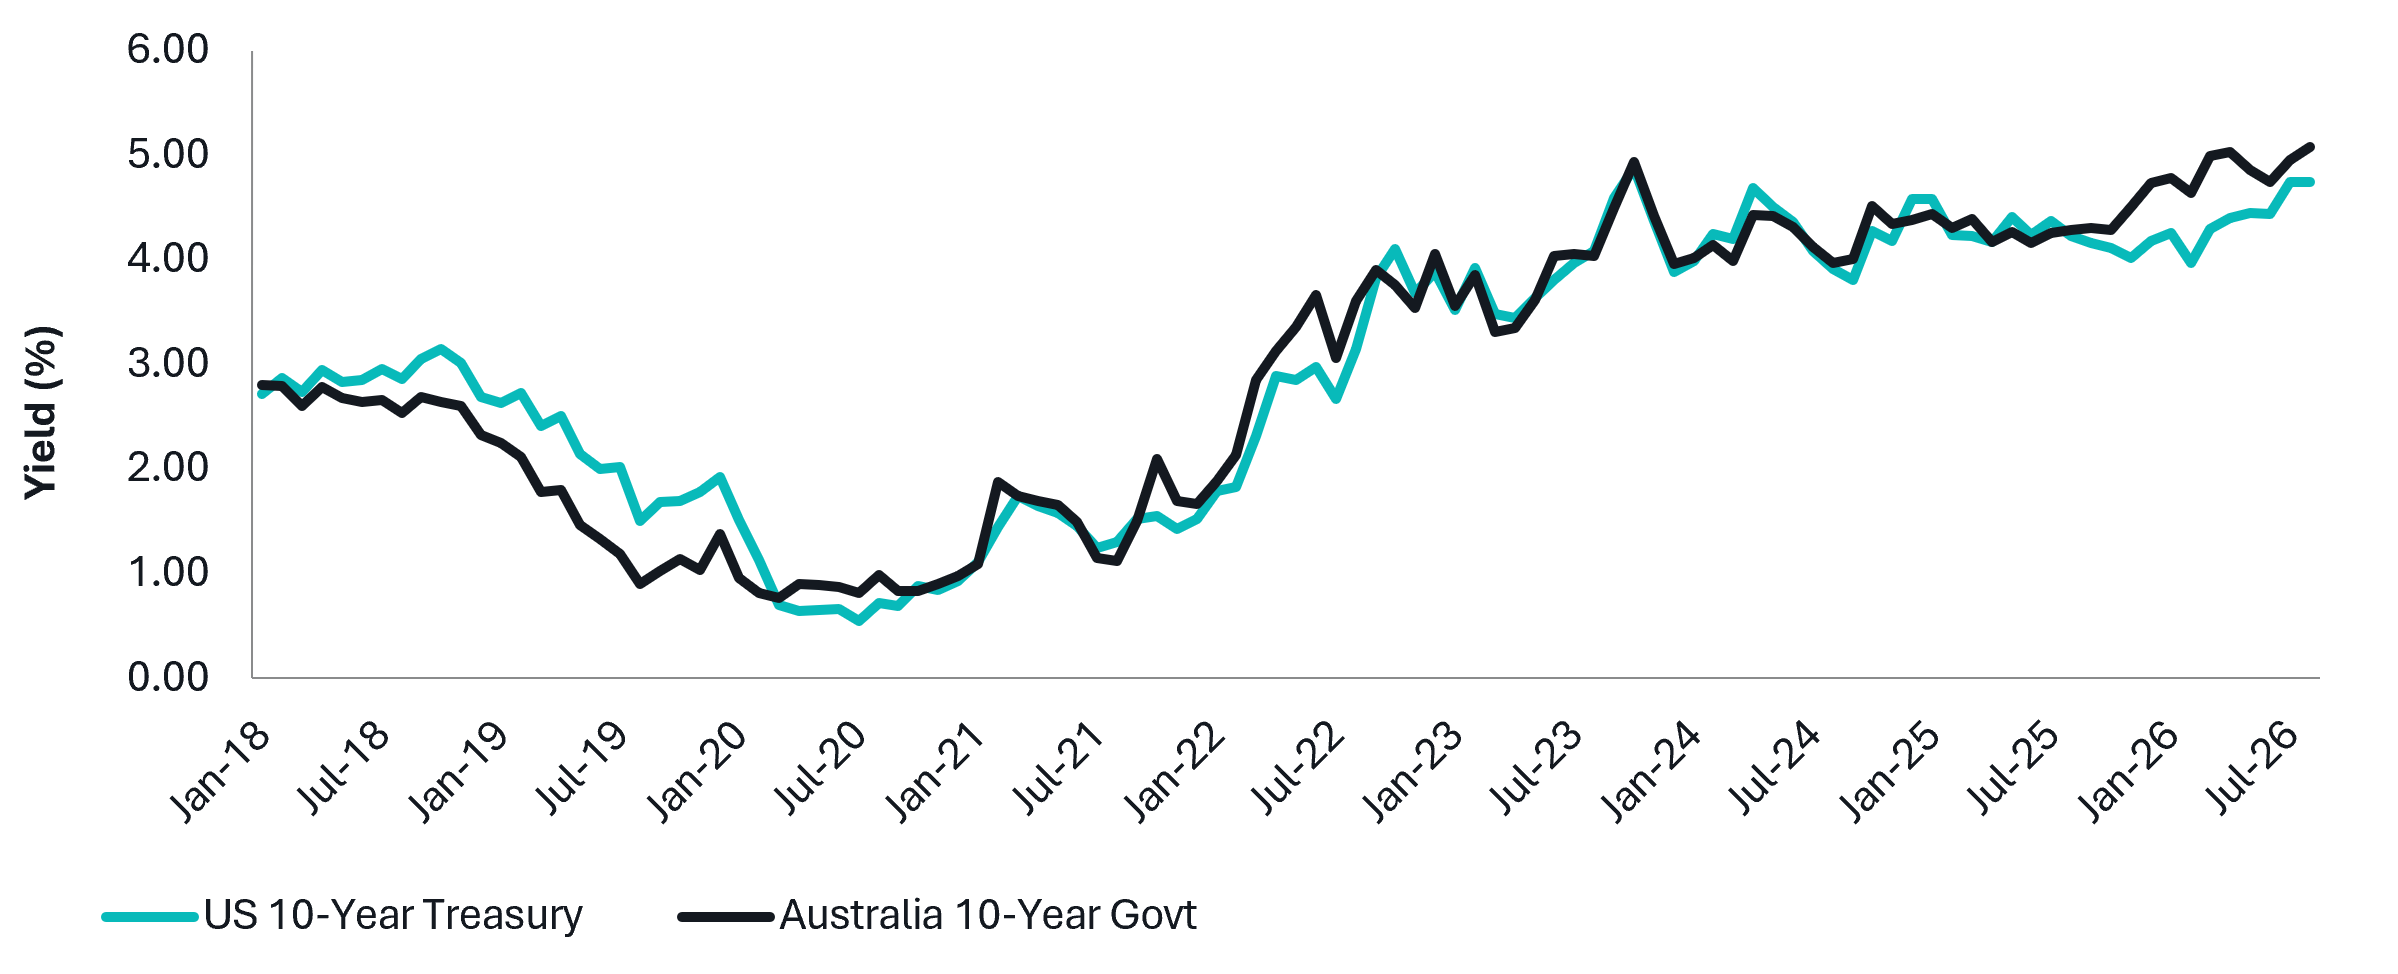
Source: S&P Global, Savana. Month-end 10-year government bond yields for the United States and Australia, January 2018 to August 2026.
We believe inflation is a major part of the problem. The US Consumer Price Index (CPI) remained at 3.4% year-on-year in July, while core Personal Consumption Expenditures (PCE) was 3.3%. The Iran conflict added another source of pressure late in the month: Brent crude jumped 2.7% to US$90.49 per barrel on 30 August after renewed US-Iran strikes, while vessel traffic through the Strait of Hormuz remained below pre-war levels. By 31 August, markets were pricing approximately a 58% probability of a Fed rate increase in September.
The supply side is becoming equally important. US federal debt has passed US$40tn, more than double its level in 2017. At the same time, hyperscalers are turning to bond markets to fund the AI build-out. AI-related corporate debt issuance had reached approximately US$220bn by late August, compared with US$12.5bn over the equivalent period in 2025. Amazon raised US$25bn, with the deal pricing at around 120 basis points over Treasuries, while Alphabet followed its US issuance with an A$5.5bn Australian bond sale that attracted more than A$18bn of orders.
The same investment cycle supporting semiconductor and cloud earnings is also creating one of the largest new sources of corporate borrowing. Governments funding large deficits and hyperscalers funding data centres are competing for the same investor capital - and investors are demanding more compensation to provide it.
For equities, the arithmetic becomes harder as that risk-free rate rises. A 5% Treasury yield raises corporate borrowing costs and the discount rate applied to future cash flows, while offering investors nearly 5% without taking equity risk.
The S&P Small Cap 600 gained 23.90% in the first half of 2026, but has since declined approximately 2.49%, including 0.6% in August.
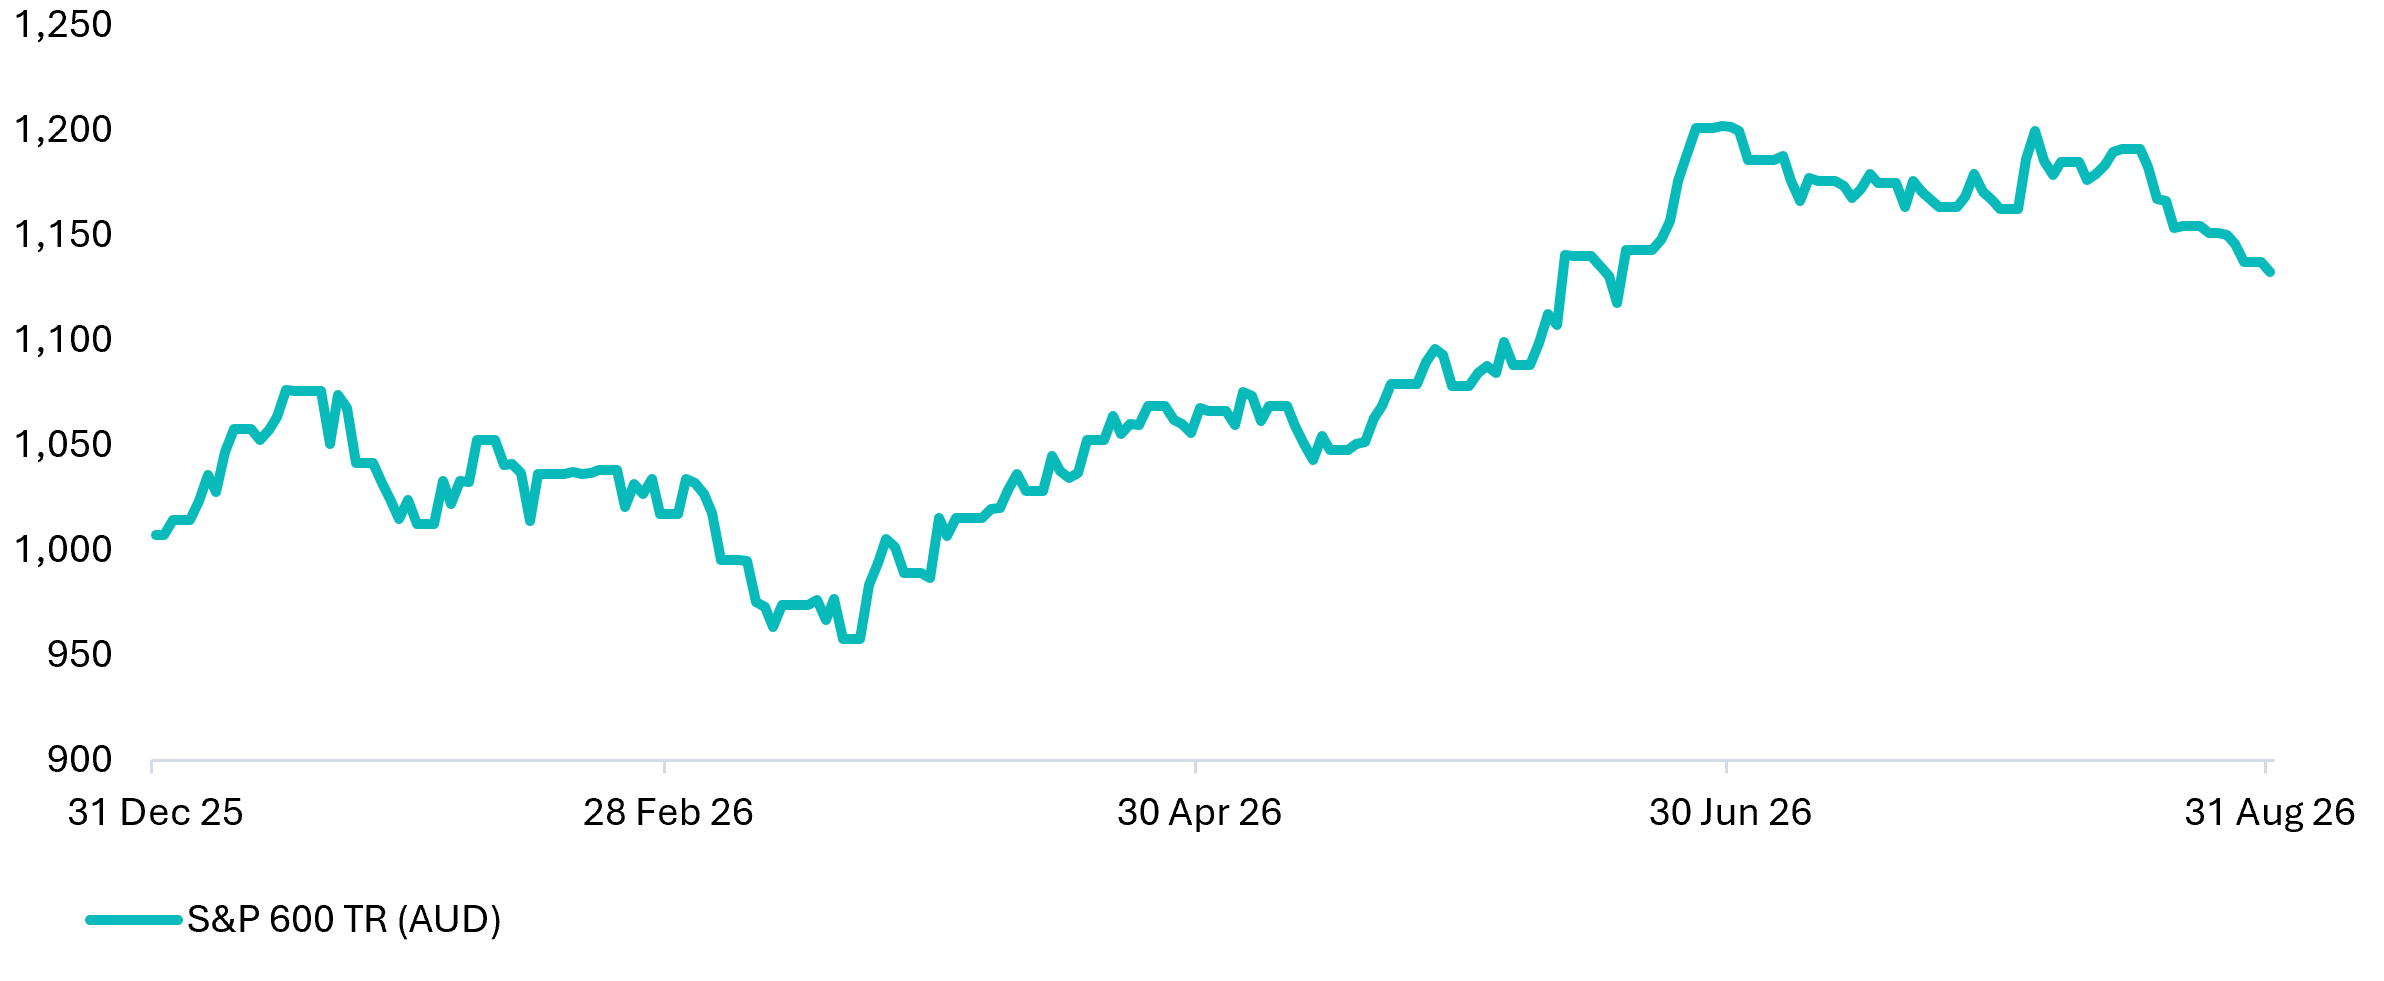
Source: S&P Global, Savana. S&P SmallCap 600 total return index (AUD), 31 December 2025 to 31 August 2026. Past performance is not indicative of future performance.
There is still a meaningful valuation gap. The S&P 600 trades at approximately 15.5x forward earnings, compared with around 20.3x for the S&P 500 - a discount of almost 25%. But the composition of this year's return shows that investors have already brought forward a substantial amount of expected improvement.
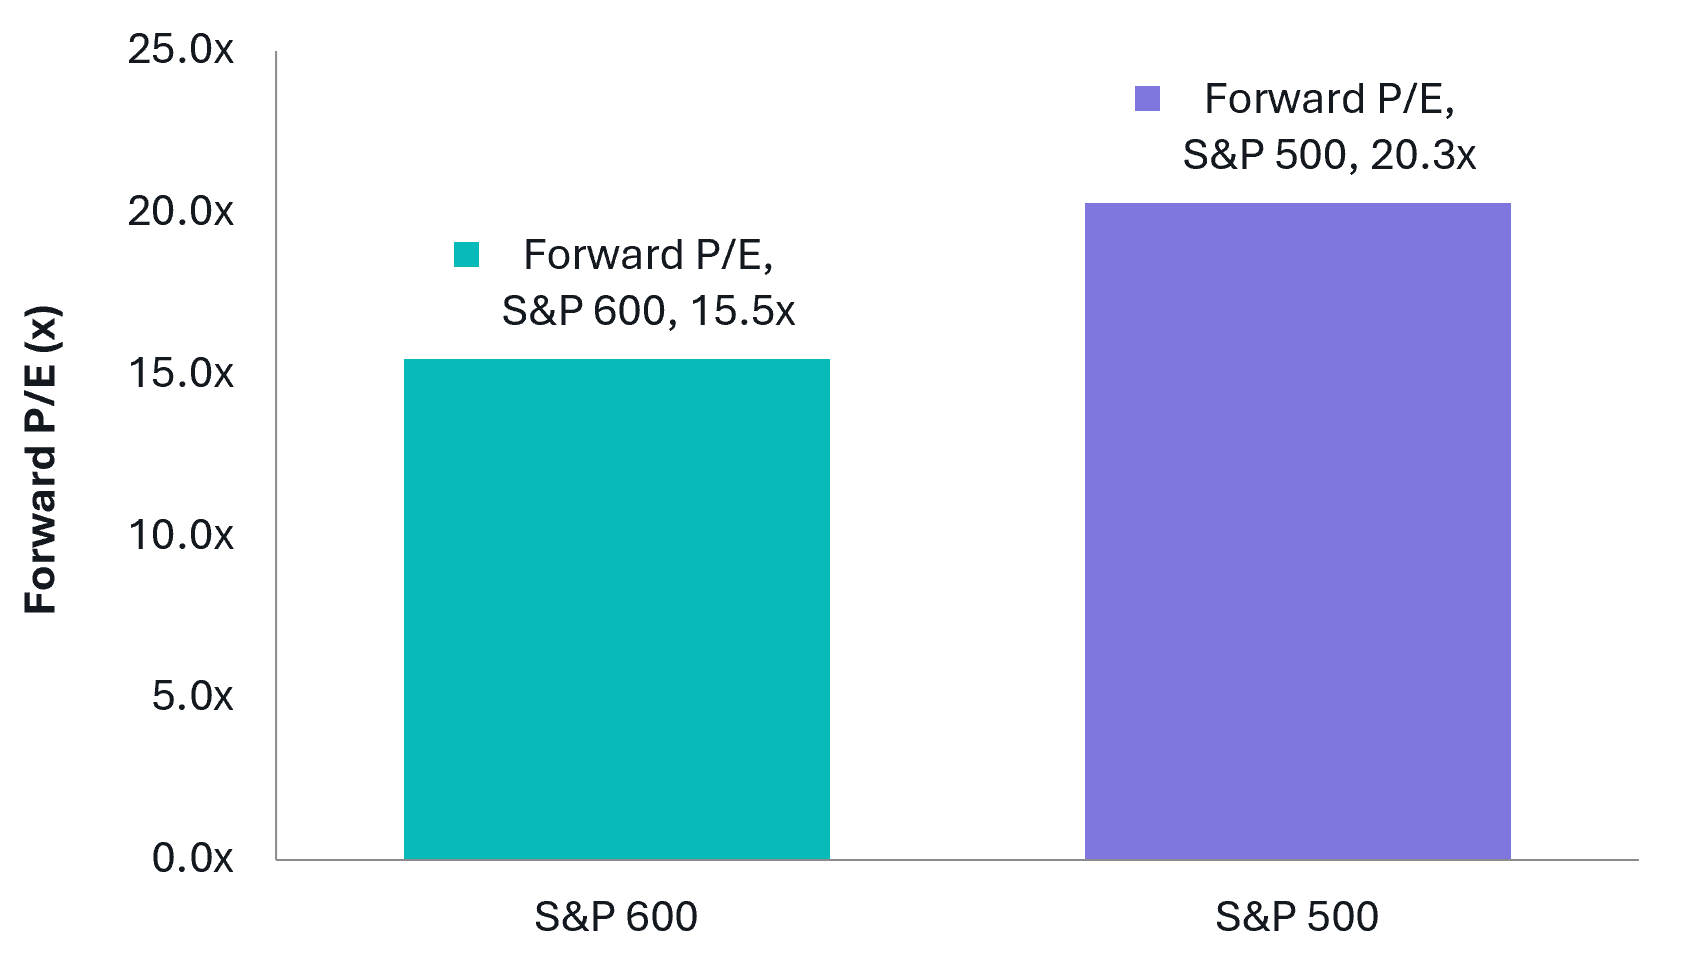
Source: S&P Global, Savana. Forward price-to-earnings multiples for the S&P SmallCap 600 and the S&P 500, as at 31 August 2026.
S&P data shows that trailing S&P 600 earnings have increased only 5.3% year-to-date, while the Index's trailing P/E has expanded by 3.54 turns. At the same time, the forward P/E has fallen by 0.89 turns. Prices have therefore risen much faster than the earnings being generated today, while analysts have lifted future earnings expectations even faster than prices.
That leaves a clear test for the remainder of the year. The first-half rally was supported by improving expectations and multiple expansion. With inflation still above target, the Fed again considering higher rates and long-term government bonds yielding close to 5%, that becomes a more difficult source of return to rely upon. Further upside increasingly requires those forward earnings expectations to be delivered.
Based on a recent Livewire Article, ‘Why most active managers lose to the market’, authored by Evan Metcalf, dated 2 September 2026.
Over the past 15 years, around 87% of active Australian equity funds have underperformed their benchmark, while more than 90% of US large-cap managers have underperformed the S&P 500. Across every category with a 10-year record, at least three quarters of active managers have fallen short.
We think there are two structural reasons why.
The first is the competition. A share price reflects the combined judgement of millions of investors, each bringing different information, experience and expectations. In large, liquid and heavily researched markets, that collective judgement is exceptionally difficult for any individual manager to consistently outguess.
The second is that most active strategies view the market through a relatively narrow lens. A value manager looks for cheapness; a quality manager for durable businesses; a momentum manager for trends. Each approach can work, but each also carries persistent blind spots. When the market stops rewarding that particular style, underperformance can persist for years.
The common problem is limited diversity of judgement.
This is also what makes markets themselves so effective at processing information. A sufficiently large and diverse crowd can be more accurate than even its strongest individual members because different errors offset one another. The lesson for active management is that the answer may not be to find one better investor or one better model, but to combine many genuinely independent ways of assessing the same company.
That principle sits at the centre of Savana's investment process.
Each day, our algorithms value approximately 60,000 listed companies, combining the outputs of many independent models that assess company fundamentals in different ways. Every company receives a score that is not one analyst's opinion but the combined output of many independent models, each reading its fundamentals a different way, aggregated by our algorithms into a single figure between 0 and 1, where 0.5 marks our estimate of a fairly valued company. In effect, we construct a diverse, disciplined crowd of our own and let it vote, at a scale and consistency that would be difficult to replicate manually.
Plot every US-listed company by that score against its size, and the pattern appears in the data. Large companies sit close to fair value, priced efficiently by their deep and varied following. Mispricing concentrates further down the size scale, among smaller, less-watched companies where the crowd is thin. That undervalued corner is where we concentrate capital.
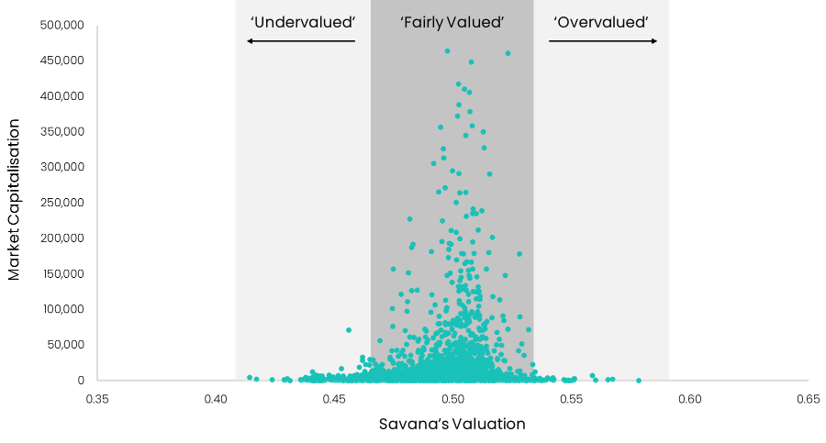
Source: Savana. Savana’s valuation of NYSE and Nasdaq listed companies as of February 2026. For visibility, market capitalisations are capped at US$500bn. Valuations represent the opinion of Savana’s algorithmic process and do not represent definitive measures of intrinsic value. Please note that this is a one-off, point in time statistical analysis for the purposes of illustrating Savana’s valuation process.
Whether those undervalued companies actually go on to outperform is a question we believe we can test directly, and we have. For every company we valued across a decade, we grouped it by its score and measured the return over a subsequent period. We use two months as the most reliable horizon: shorter windows are lost to trading noise, longer ones let fresh information blur the signal. The result is an orderly staircase. The most undervalued group returned an average of 5.80 per cent over the following two months, each group earned less than the one before it, and the most overvalued lost money, across more than 145,000 company observations in the ten years to 2025.
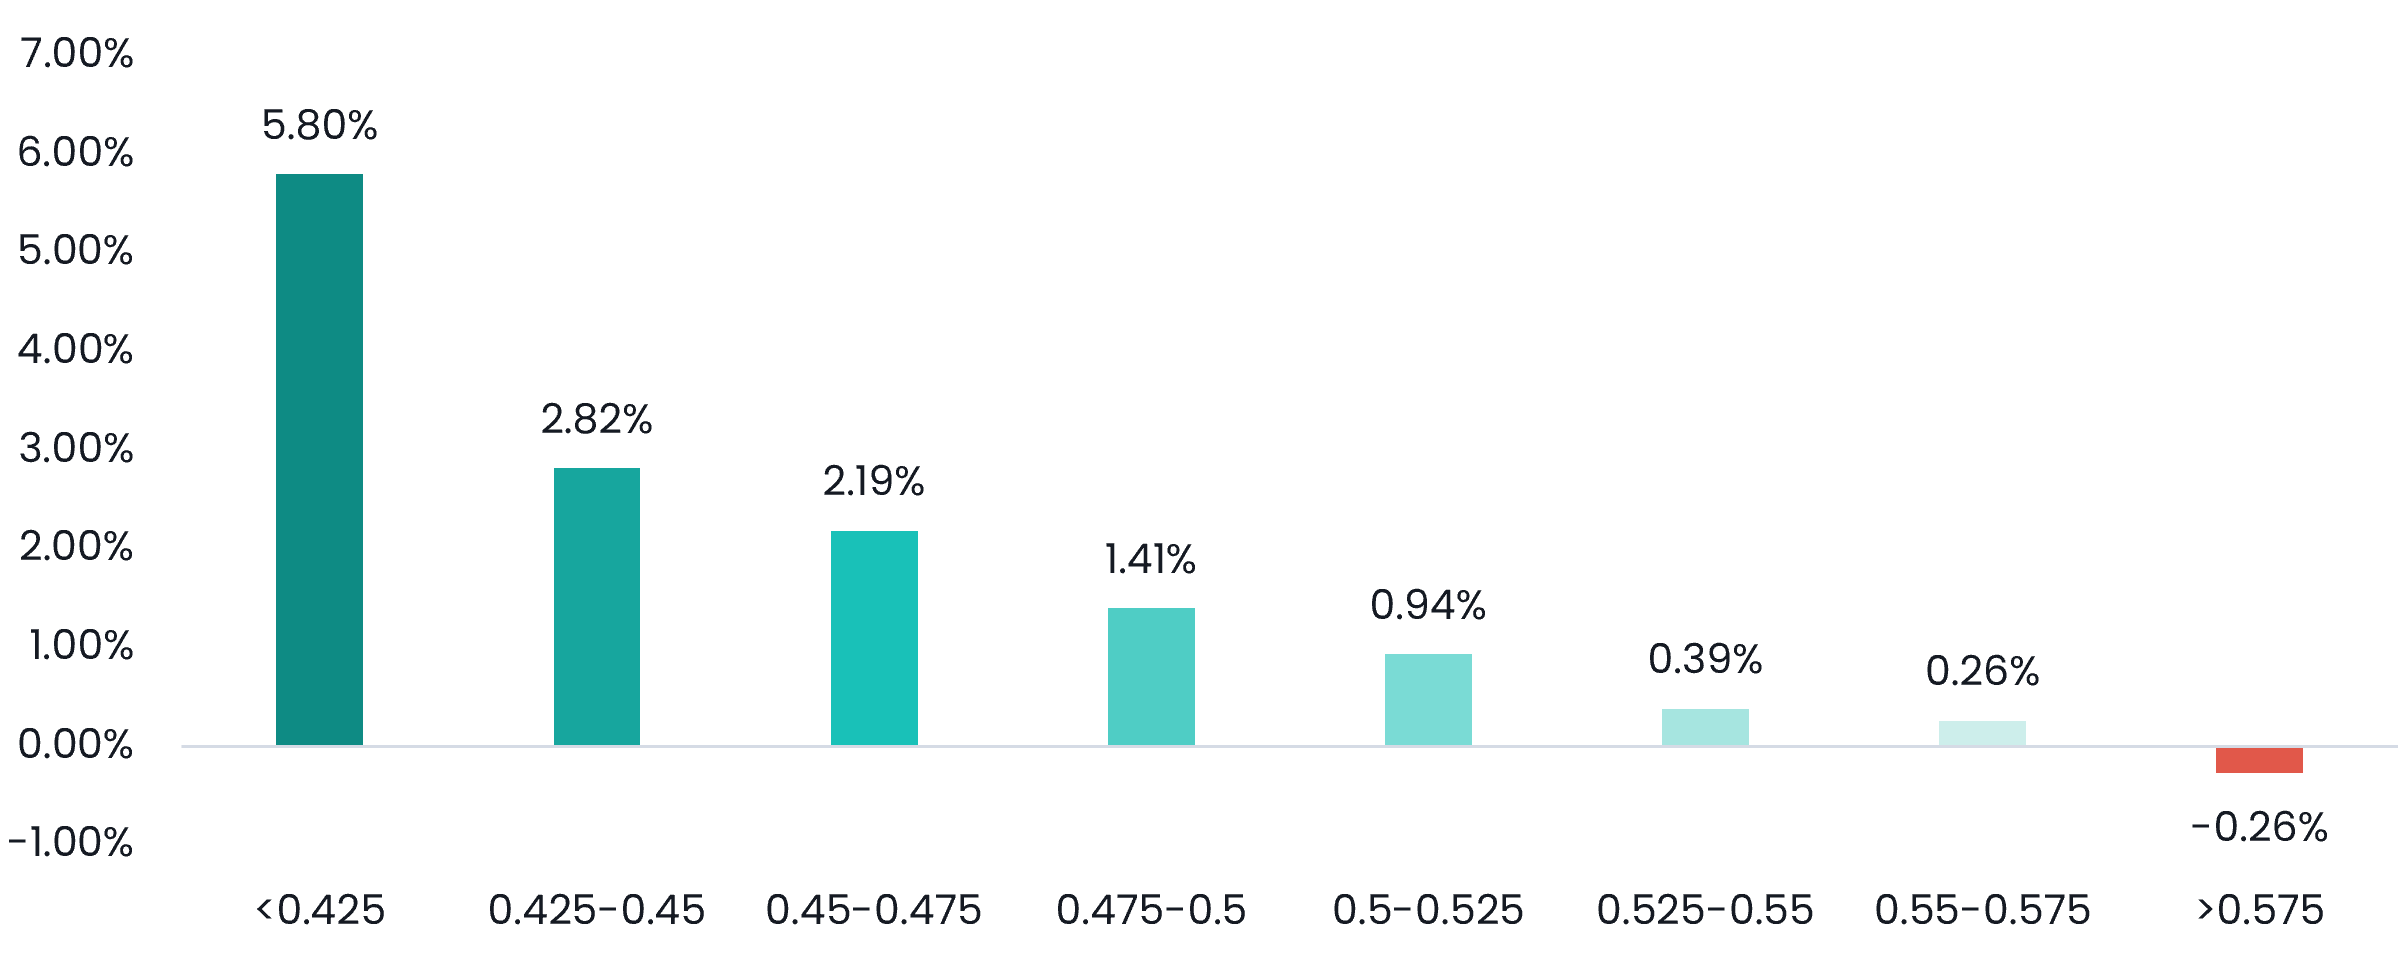
Source: S&P Global, Savana. Average bi-monthly returns by Savana’s valuation outputs, spanning all NYSE and NASDAQ companies over a 10-year period from 1-Jan-15 to 1-Jan-25. Companies are assigned a valuation score between 0 and 1, with 0.5 representing intrinsic fair value. Scores are grouped into eight evenly spaced buckets from undervalued (left) to overvalued (right). Two-month returns are consistent with the bi-monthly rebalancing frequency of Savana’s live portfolios. Return distributions are winsorized (clipped) at the 1st and 99th percentiles to control for extreme outliers. Please note that this was a fixed 10-year empirical study to test Savana’s determined valuation scores and is not reflective of current fund performance.
Two points follow. The signal does not make us right about every company, and it does not need to. On average, the companies it rates as cheap have outperformed those it rates as dear, and the upside of the winners has tended to outweigh the downside of the losers, an asymmetry that partly reflects a bias toward beaten-down companies with strong fundamentals that have more room to recover than to fall.
The usual caveats apply in full: signals decay, markets change, and past results do not guarantee future ones. But the reason most active managers underperform is neither mysterious nor a matter of luck. They compete against the market's collective intelligence without enough diversity of their own. The alternative is to construct a collective intelligence of your own, keep it diverse, and apply it across the market, pressing hardest where the crowd is thinnest and the mispricing largest. The aim is not one good year. It is a process that can apply the same discipline, again and again.