Most active funds underperform, and the reasons are structural, not bad luck. Understand them and there is a better way to be active.
The arithmetic of active management
Start with the numbers. Over the past fifteen years, around 87 per cent of active Australian equity funds underperformed their benchmark, and in US large caps more than 90 per cent underperformed the S&P 500. This is not a one-off. In every category with a ten-year record, three quarters or more of active managers failed to beat their benchmark. It is among the most consistent findings in funds management, and it is a large part of why capital has moved so steadily into passive strategies, much of it through the rapid growth of exchange traded funds.
This is not a verdict on the people. The industry is full of skilled, diligent investors with good information. The cause is structural, and there are two reasons for it.
The first is that most active managers set themselves the hardest possible task. A share price is not one person's opinion but the pooled judgment of millions of buyers and sellers, each acting on their own information. In the large, liquid, heavily researched part of the market where most funds operate, that pooled judgment already reflects almost everything a manager could know. Consistently outguessing it, before fees, is close to a losing proposition.
The second reason is subtler. Most active strategies are built around a single way of seeing the world. A value manager buys cheapness, a quality manager buys durable franchises, a momentum strategy follows the trend, a discretionary manager backs their own judgment. Each lens works until the market stops rewarding what it measures. And a single lens does not fail at random: it fails in a consistent direction, because its blind spots are fixed. That is why capable managers can endure long, correlated stretches of underperformance. Add a fee, and the odds lengthen further.
Even the managers who do beat the market rarely keep beating it, because the human judgement behind the results drifts over time as form, style and emotion shift. So the question that matters is not whether a manager can beat the market once, but whether a process can do it repeatedly.
What makes a forecast accurate
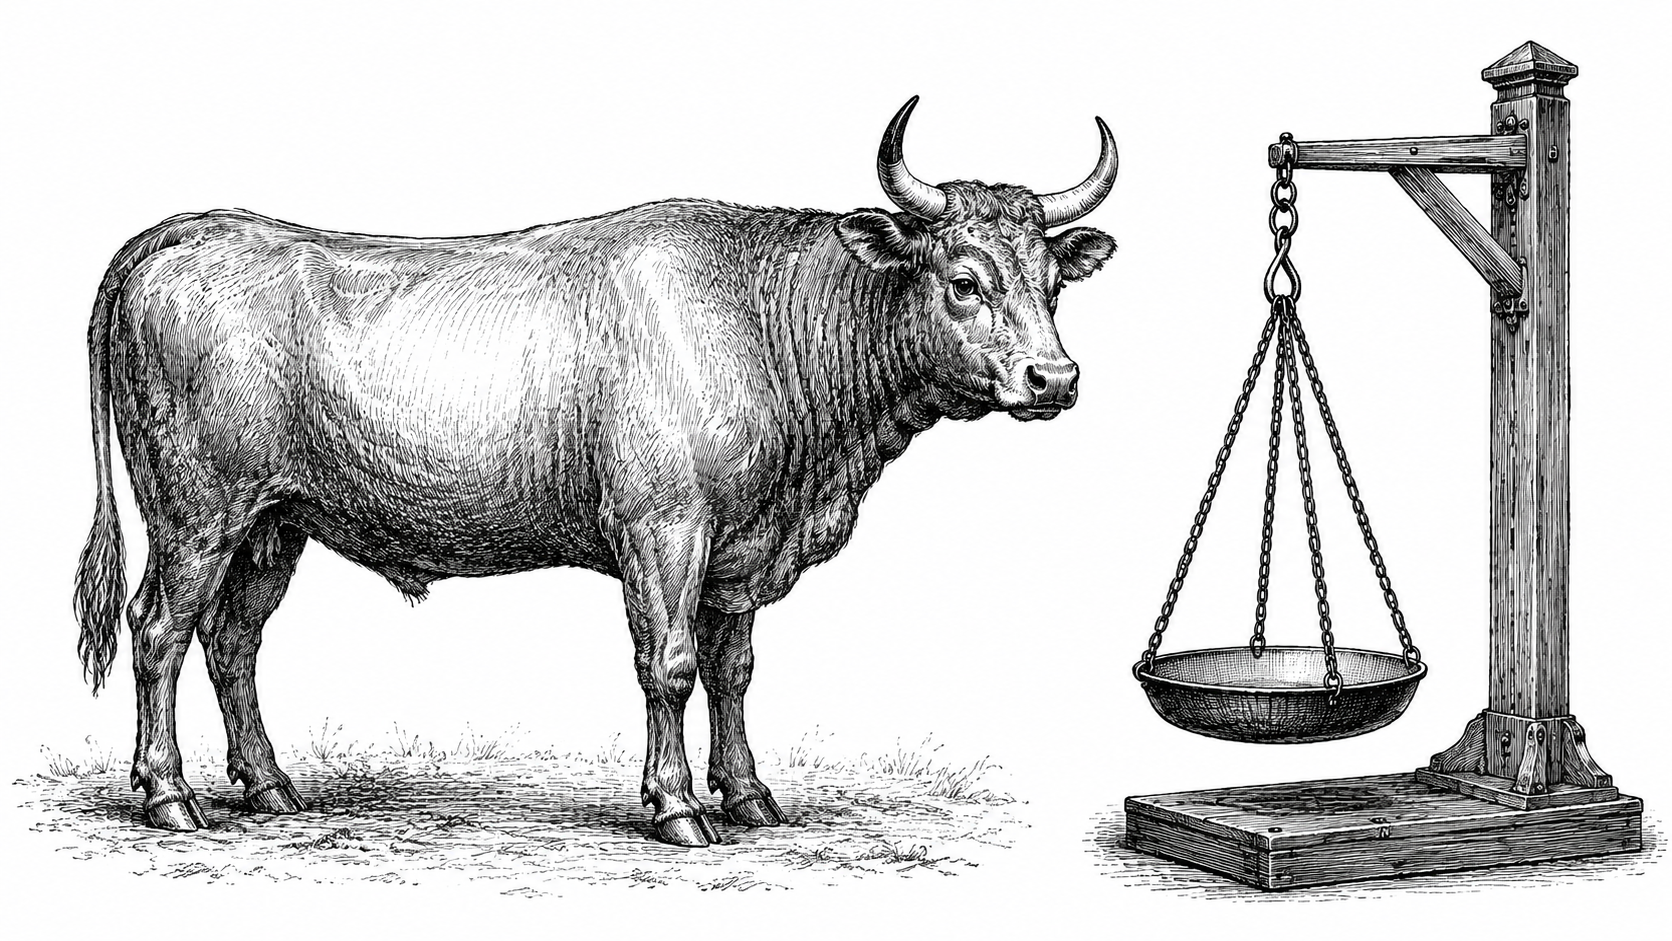
These problems point to the same way out. The reason the market is so hard to beat is the reason a diverse crowd can estimate the weight of an ox more accurately than any single expert, the effect we examined in an earlier piece. A large, diverse, independent group makes smaller errors than its cleverest member, because the members' mistakes are uncorrelated and cancel out. Accuracy comes from cognitive diversity, not individual brilliance, and that diversity is exactly what a single manager working through one dominant lens cannot usually supply.
The cognitive scientist Emile Servan-Schreiber, in his work on collective intelligence, sets out how such a crowd can be constructed rather than merely found. A central idea is that two ingredients drive a group's accuracy, the skill of its members and the number of diverse, independent participants, and that the two are partly interchangeable: enough varied contributors can compensate for limited individual skill, and higher skill can compensate for smaller numbers. Either lever lowers the collective error. He points to, among other examples, prediction markets, where large groups of non-experts, each acting on their own information, have forecast uncertain events as accurately as, and at times more accurately than, panels of specialists. The principle is the one that matters here: combine enough genuinely diverse and independent views and the aggregate reliably beats the individual.
This reframes what good active management can look like. The answer to the single-lens problem is not a better or more complex lens but many independent ones combined into a constructed crowd, so that no single view runs the book and the errors offset. The same principle runs through modern machine learning, where the systems that win forecasting competitions are almost never one elegant model but ensembles that blend many, precisely because their errors differ. A constructed crowd of this kind works across the whole market. Its advantage is simply largest where the real crowd is weakest and least diverse: among the smaller, neglected companies that fewer investors follow, where a single story can set the price and mispricing more readily survives.
A crowd of our own, pointed at the gaps
This is the approach Savana is built to run. Each day, our technology values roughly 60,000 listed companies with no manual intervention. Every company receives a score that is not one analyst's opinion but the combined output of many independent models, each reading its fundamentals a different way, aggregated by our algorithms into a single figure between 0 and 1, where 0.5 marks our estimate of a fairly valued company. In effect, we construct a diverse, disciplined crowd of our own and let it vote, at a scale and consistency no research team could reach by hand.
Plot every US-listed company by that score against its size, and the pattern appears in the data. Large companies sit close to fair value, priced efficiently by their deep and varied following. Mispricing concentrates further down the size scale, among smaller, less-watched companies where the crowd is thin. That undervalued corner, which we call the high probability alpha zone, is where we concentrate capital.
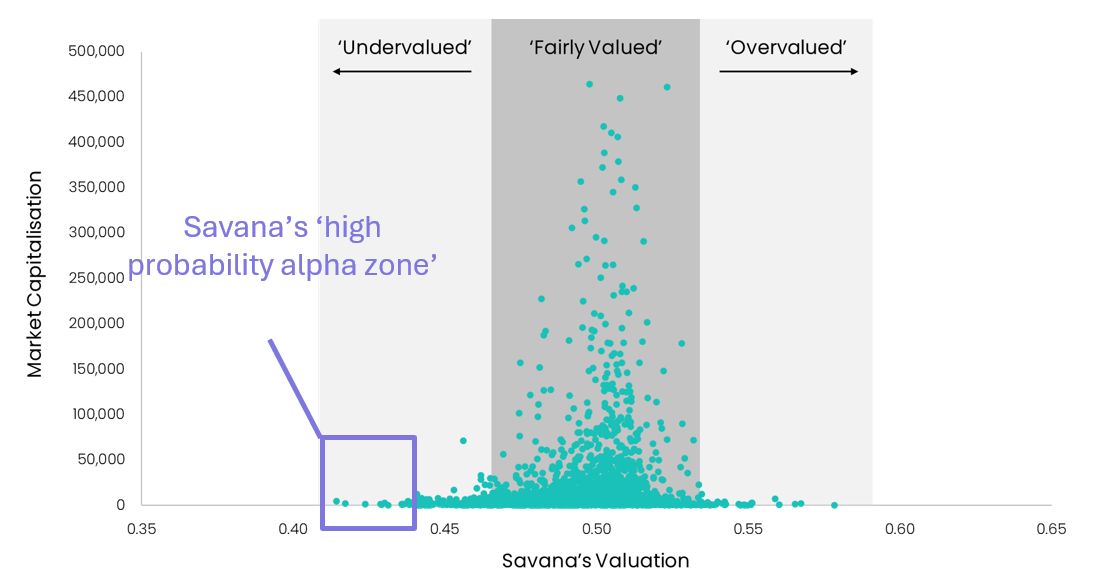
Figure 1. Savana's valuation of every US-listed company, plotted by valuation score (0 is deeply undervalued, 0.5 is fair value, 1 is deeply overvalued) against market capitalisation. The high probability alpha zone sits in the lower left. Source: Savana, as at February 2026. Valuations represent the opinion of Savana's algorithmic process and are not definitive measures of intrinsic value.
Whether those undervalued companies actually go on to outperform is a question we can test directly, and we have. For every company we valued across a decade, we grouped it by its score and measured the return over a subsequent period. We use two months as the most reliable horizon: shorter windows are lost to trading noise, longer ones let fresh information blur the signal. The result is an orderly staircase. The most undervalued group returned an average of 5.80 per cent over the following two months, each group earned less than the one before it, and the most overvalued lost money, across more than 145,000 company observations in the ten years to 2025.
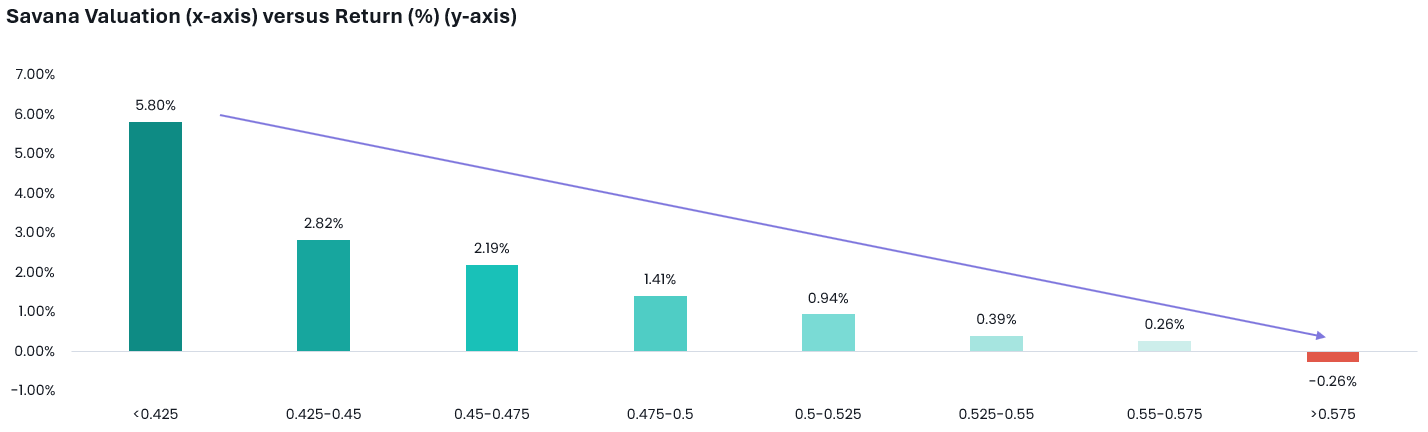
Figure 2. Average two-month forward returns for every NYSE and NASDAQ company, grouped from most undervalued (left) to most overvalued (right), 1 January 2015 to 1 January 2025. Source: S&P Global, Savana. Returns are winsorized at the 1st and 99th percentiles to control for outliers. Past performance is not indicative of future performance.
Two points follow. The signal does not make us right about every company, and it does not need to. On average, the companies it rates as cheap have outperformed those it rates as dear, and the upside of the winners has tended to outweigh the downside of the losers, an asymmetry that partly reflects a bias toward beaten-down companies with strong fundamentals that have more room to recover than to fall. And the same staircase appears when the identical test is run on other markets, so it is not an artefact of one market or one time period.
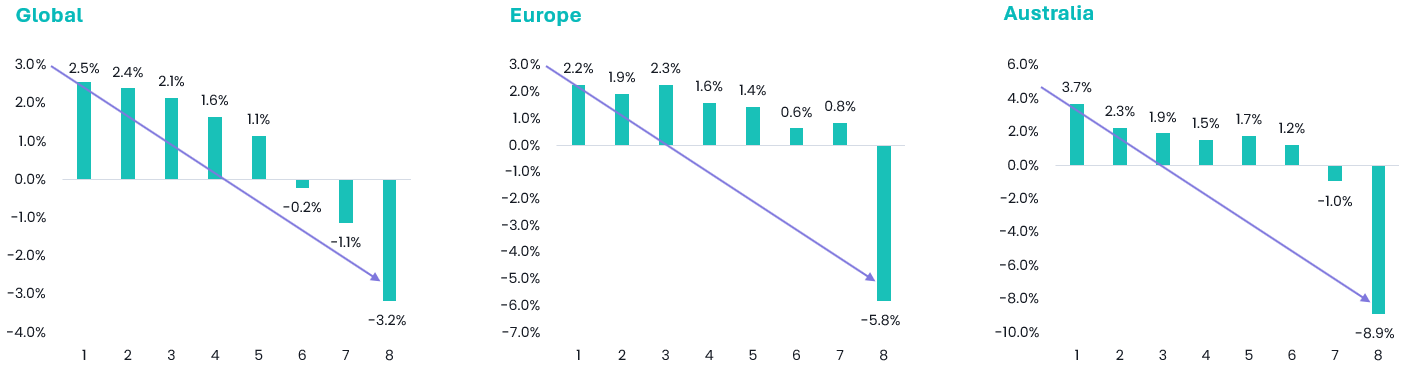
Figure 3. The same pattern, across markets. Average two-month forward returns by Savana valuation group for US, European, Australian and global equities, 1 January 2015 to 1 January 2025. Source: S&P Global, Savana.
The strategy now runs on live capital. Since launching in November 2024, Savana US Small Caps Active ETF (ASX: SVNP) has returned 16.3 per cent per annum after fees against 5.3 per cent for its S&P Small Cap 600 benchmark, and 25.2 per cent over the past twelve months against the benchmark's 11.9 per cent. It is one fund in one segment, and its live record is still short, but it is early real-world confirmation of the pattern the data describes.
Repeatability is designed in. Human judgement drifts; a rules-based system does not. It acts on data rather than sentiment, so it will buy when prices are falling if the evidence supports it, and sell a holding when its score turns rather than hold on to a favourite. The same rules apply in every market and every mood, which is what gives an edge the chance to persist rather than fade.
The usual caveats apply in full: signals decay, markets change, and past results do not guarantee future ones. But the reason most active managers underperform is neither mysterious nor a matter of luck. They compete against the market's collective intelligence without enough diversity of their own. The alternative is to construct a collective intelligence of your own, keep it diverse, and apply it across the market, pressing hardest where the crowd is thinnest and the mispricing largest. The aim is not one good year. It is a process that can apply the same discipline, again and again.