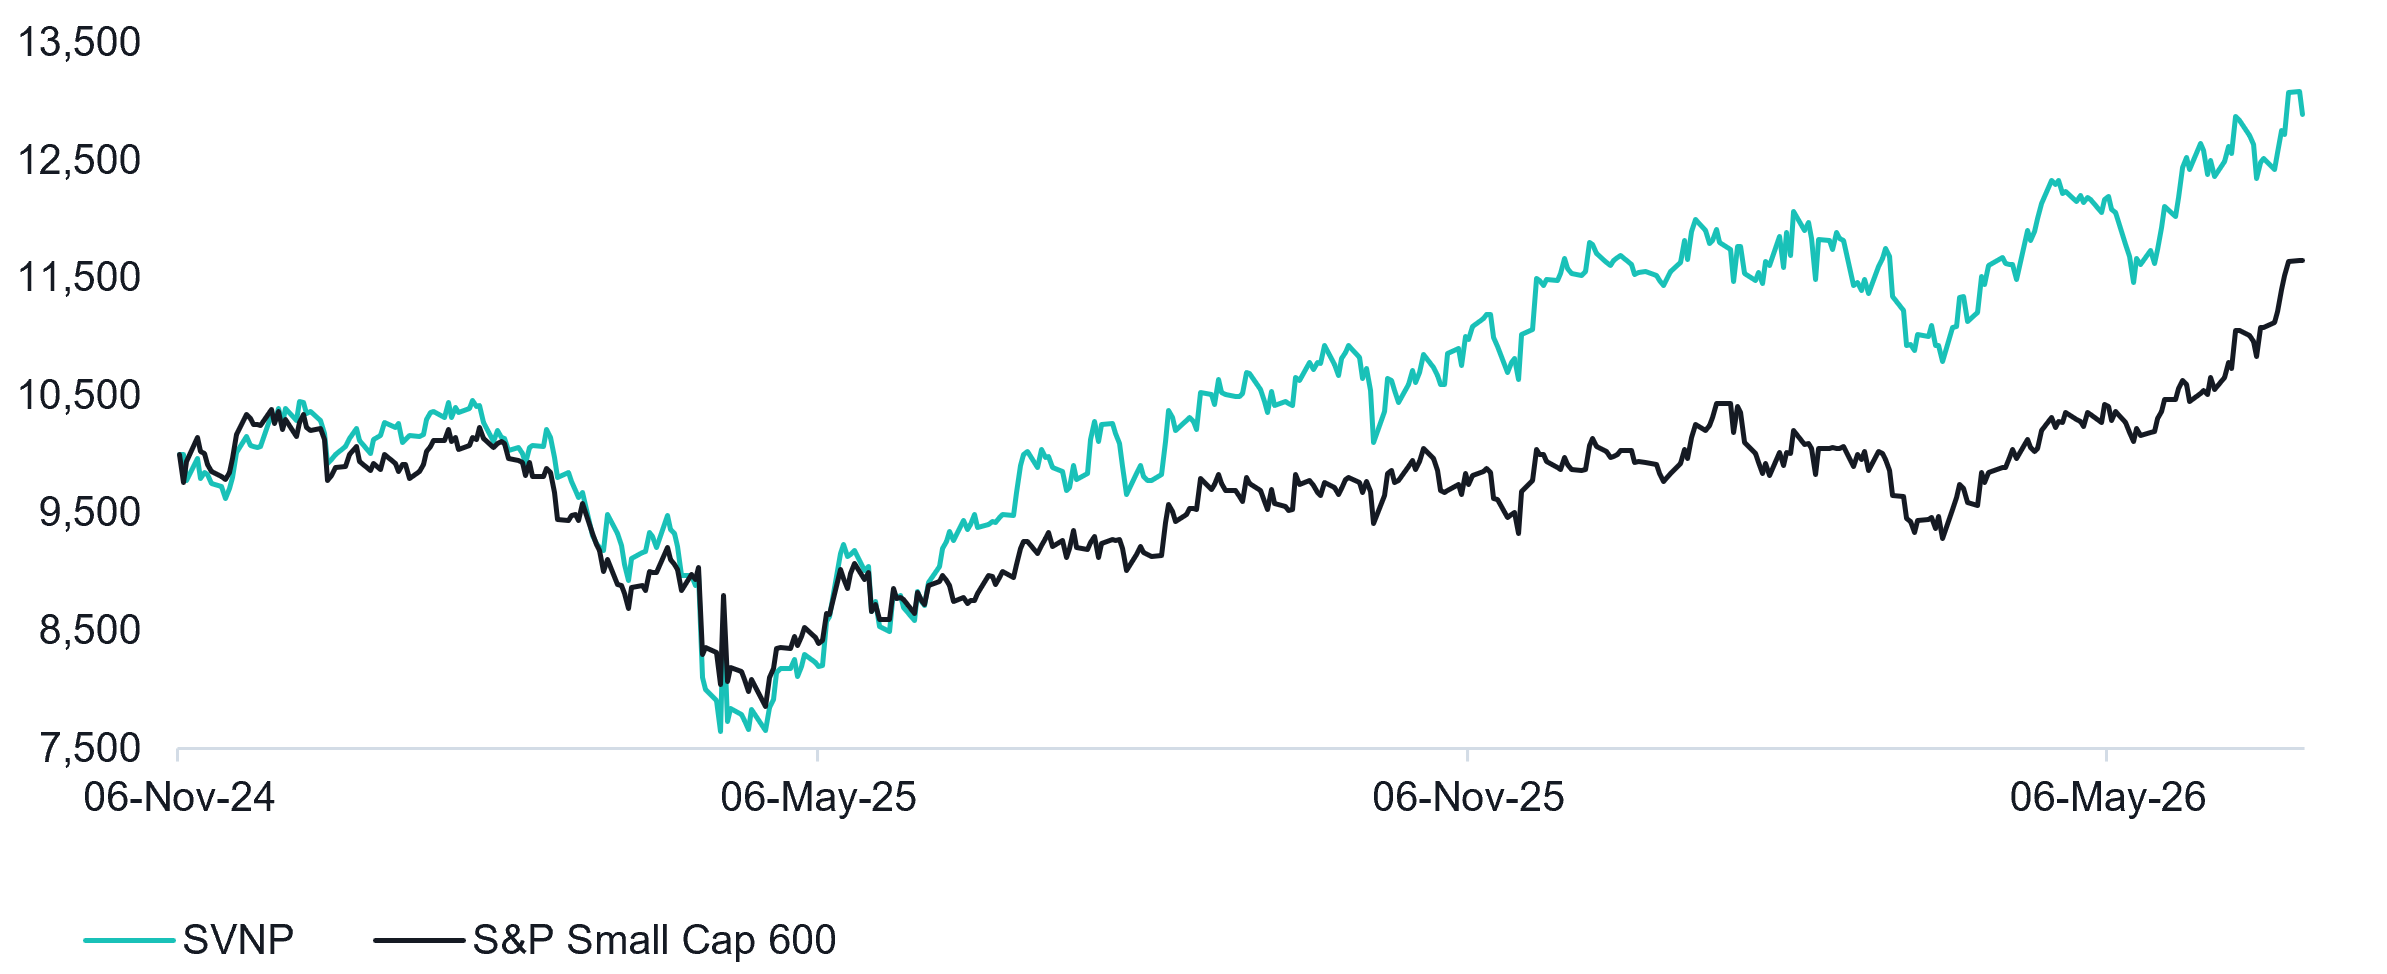
June was a mixed month for the Fund, despite a strong backdrop for US small caps. The S&P Small Cap 600 (AUD) surged 11.43% over the month, supported by two forces Savana has consistently underscored throughout the year: a narrowing of the valuation gap between small and large caps, and a strengthening US dollar against a cyclically elevated Australian dollar. Together, P/E multiple expansion across US small caps and appreciation in the USD against the AUD (+4.5%) provided a powerful tailwind for the segment.
Against this backdrop, SVNP increased 3.74% for the month, underperforming the benchmark by 7.69%. The Fund’s relative underperformance was primarily driven by a concentration of contrarian positions that did not fully participate in the rally, particularly within the Automobile and IT Consulting industries. While disappointing in the short term, outcomes of this nature are an inherent feature of Savana’s high-conviction, anti-momentum investment strategy. By design, the portfolio will not always move in lockstep with the broader market, particularly during periods when momentum-led stocks drive index returns. However, it is precisely this willingness to remain disciplined through periods of short-term divergence that has underpinned the Fund’s strong longer-term outcomes.
Value of A$10k Since Inception
Trailing & Calendar Year Returns
Source: Savana, S&P Global. The Savana US Small Caps strategy was implemented on the ASX as of the 6th of November 2024. Total returns are calculated in Australian dollars based on the close-of-day net asset value per unit as at the last day of the given period. Returns are after fees and costs with dividends reinvested. Returns for periods greater than one year are annualised. ‘Relative’ figures are the arithmetic difference between the SVNP and benchmark returns shown; the ‘Since Inception’ relative figure is therefore a per-annum differential. Past performance is not indicative of future performance.
Sector Breakdown

Top Five Exposures
This month's letter explores two themes. First, The Market Rally Investors Are Missing examines the 23.9% first-half surge in the S&P Small Cap 600 that has gone largely unnoticed by Australian investors - what has driven it, and whether it can continue. Second, The Wisdom of Many Models builds on last month's discussion of crowd wisdom, explaining why our approach combines many independent models rather than relying on any single view and why that independence is central to the Fund's long-term return potential.
While Australian investors tend to fixate on the technology-heavy mega-caps dominating the S&P 500 and Nasdaq 100, a powerful rally has been unfolding in a far less closely watched corner of the market. During the first half of the year, the S&P Small Cap 600 Total Return (USD) Index rose 23.9%, compared with 10.2% for the S&P 500 Total Return Index and just 2.4% for the S&P/ASX 200 Total Return Index.
H1 2026 Total Returns By Index

Source: S&P Global, Savana. Total return performance of the S&P Small Cap 600 (USD), S&P 500 (USD) and S&P/ASX 200 (AUD) indices over the first half of 2026. US small caps returned 23.9%, against 10.2% for the S&P 500 and 2.4% for the S&P/ASX 200. Past performance is not indicative of future performance.
Savana has highlighted the opportunity in US small caps for some time. The investment case has rested on a powerful combination of factors, including a substantial valuation gap relative to large caps, a more balanced exposure to the US economy and a growing universe of downstream beneficiaries from the artificial-intelligence investment boom. During the first half of 2026, the market began to recognise this opportunity. The more important question now is what has driven the rally and whether it can continue.
The starting point is to understand what has driven small-cap returns so far. As at 30 June 2026, the normalised price-to-earnings ratio of the S&P Small Cap 600 stood at 32.1x (based on a harmonic-mean calculation)1. This represented a 23.5% increase from 31 December 2025, almost exactly matching the index’s total return over the same period. The implication is that the rally has been driven overwhelmingly by multiple expansion, with little contribution from underlying earnings growth. This further demonstrates that the rally is predicated on expectations rather than results, marking a critical shift in sentiment and symptomatic of a rotation in capital from large to small cap stocks.
One of the most notable facets of this rally has been the broad participation across sectors. Based on the iShares Core S&P Small-Cap ETF, which tracks the S&P Small Cap 600 Index, all eleven GICS sectors delivered returns of at least 10% during the first half of the year.
S&P Small Cap 600 Sector Returns: H1 2026

Source: S&P Global. Sector total returns for the first half of 2026, based on the iShares Core S&P Small-Cap ETF, which tracks the S&P Small Cap 600 Index.
Information Technology has been the biggest driver, up 63%. This has largely been led by an uncovering of opportunities in downstream “picks-and-shovel” businesses supporting the technology hardware investment cycle. These include communications systems-on-chip provider MaxLinear (+635%), fluid delivery components provider Ultra Clean Holdings, Inc. (+463%), and equipment manufacturer Vishay Intertechnology, Inc. (+274%). Of the 20 best-performing companies in the S&P Small Cap 600 in 2026, eleven are Information Technology and seven are directly semiconductor-related.
S&P Small Cap 600: Top Performers of 2026

Source: S&P Global. Total returns of the best-performing constituents of the S&P Small Cap 600 during the first half of 2026.
Despite the rapid multiple expansion observed in the first half of 2026, the S&P Small Cap 600 continues to trade at a substantial relative discount to the S&P 500 on a forward P/E basis. As of 30 June 2026, the S&P Small Cap 600 forward price-to-earnings ratio is 16.9x, representing a ~20% discount to the S&P 500 (forward P/E of 21.2x) and an 8% discount its own 20-year historical average2. This indicates that, even after six months of strong gains, the re-rating may have further to run.
Forward P/E Ratio: Large v Small Caps

Source: S&P Global, Savana. Forward 12-month price-to-earnings ratios, 2006 to 30 June 2026. The S&P Small Cap 600 trades at 16.9x forward earnings against 21.2x for the S&P 500, a discount of approximately 20%, and roughly 8% below its own 20-year historical average.
The clearest external risk to the rally is monetary policy. At the start of the year, following rate cuts between August 2024 and December 2025, the market assigned a 74% probability to the federal funds target rate falling to 3.25% or below by year-end, against its current range of 3.50% to 3.75%. That probability has since fallen to zero; indeed, the market now prices an 85% likelihood that the next move in rates will be upward3. The reversal has been driven principally by stronger-than-expected economic growth and persistent energy-price pressure arising from conflict in the Middle East: headline inflation has risen from 2.4% in January to 4.2% in May, though core inflation - less exposed to volatile commodity and energy prices - remains far more contained at 2.90%.
That this rally has occurred despite a deteriorating monetary outlook challenges the widely held view that small caps are acutely sensitive to rate movements, and points to genuine resilience among the index's underlying constituents. Even so, a further shift towards tightening remains a potential catalyst for the rally to fade.
US Inflation and Unemployment 2026
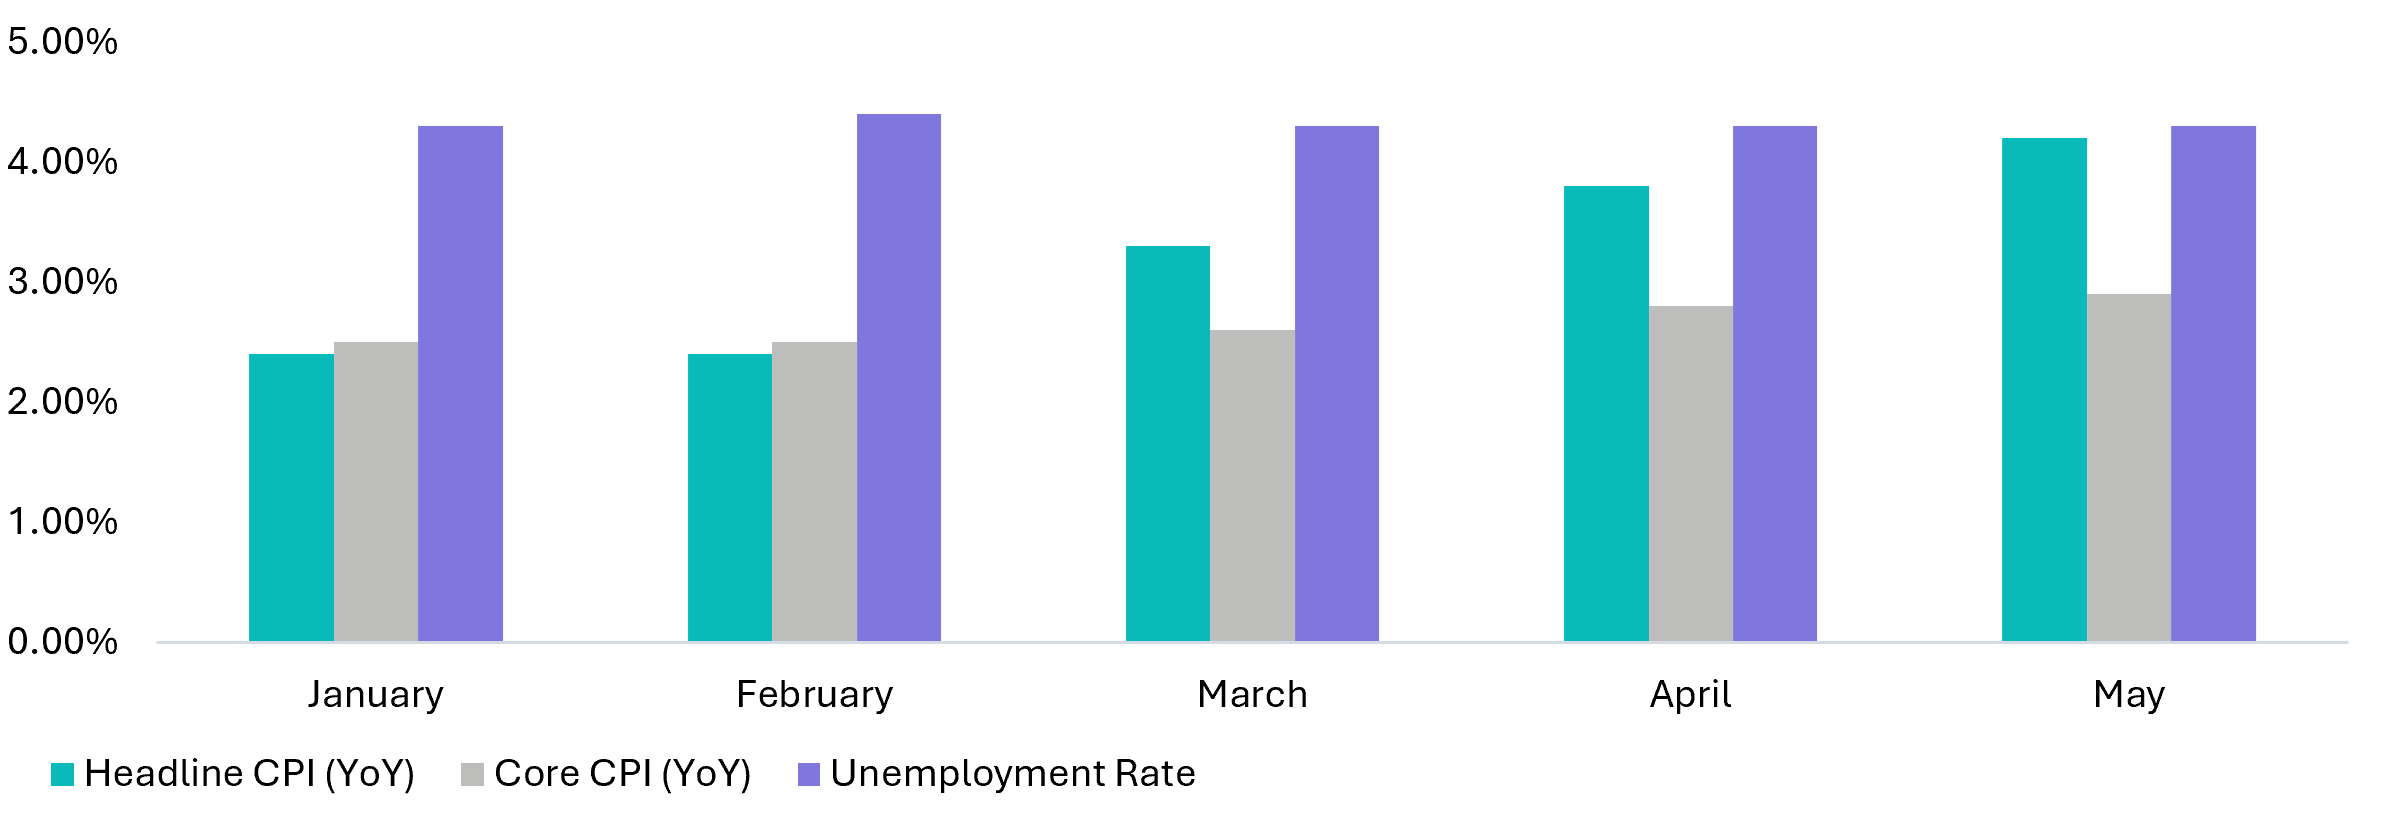
Source: U.S. Bureau of Labor Statistics, Savana. Headline CPI, core CPI (year-on-year) and the unemployment rate, January to May 2026. Headline inflation has risen from 2.4% to 4.2%, driven largely by energy prices, while core inflation remains more contained at 2.9%.
As always, the most important determinant of whether the rally continues will be the trajectory of underlying earnings. According to Bloomberg data, the S&P Small Cap 600 is projected to deliver earnings growth of approximately 18% in both 2026 and 20274. If achieved, that growth would validate the expectations already embedded in prices and provide a more durable foundation for further gains. If earnings fall short, the segment’s continued valuation discount to large caps should provide some margin of safety, although it would not fully insulate investors from a possible reversal in sentiment.
As for SVNP, we believe the conditions described above remain supportive of a rising small-cap market. Importantly, however, our strategy is driven by stock selection rather than the direction of the broader index. That can lead to periods of meaningful divergence, but this differentiation is also central to the Fund’s long-term return potential. A genuinely active strategy will not always move with the market, and it is precisely this independence from broad market momentum that creates the opportunity for sustained outperformance over time.
One model is a liability. An ensemble of many models beats the best of them, just as a diverse crowd beats its cleverest member.
Our last piece on the Wisdom of Crowds argued that markets are wise under particular conditions, and that the wisdom comes as much from the diversity of the crowd as from the skill of anyone in it. The mathematics is emphatic on this point: a crowd's error shrinks as the diversity of its views grows, quite apart from how good any individual member is. The uncomfortable implication for a stock picker is that being right more often than the crowd is not easy. You are competing against the cancellation of millions of independent errors, and that is a hard thing to beat.
This piece is about a second idea, and one we think is more useful to an investor. If diversity is what makes a crowd wise, the natural question is whether you can build that diversity on purpose rather than wait for the market to supply it. The mathematics and the many-model literature, set out most fully in Scott Page's The Model Thinker, says you can, and that the tool for doing it is not a better model but an ensemble of many.
Michael Mauboussin has spent years explaining why a crowd forecasts well, and the answer is rarely individual brilliance. A crowd is accurate because its members read the same problem differently, so their independent errors point in different directions and cancel, leaving the signal behind. The same logic carries from people to models. Hand a hard problem to a single model, however sophisticated, and its errors are built in. Combine several genuinely different models, each carrying some signal and each wrong in its own way, and those errors begin to offset.
The result is well established in the forecasting literature and blunt in its conclusion: an appropriately constructed ensemble of many models is always more accurate than the average model and is typically more accurate than the best single model among them. Not the best model on its best day. The combination, reliably, over time. This is not a finance idea, but one demonstrated in many natural problem-solving phenomena in physics and biology, which is part of why we trust it. The United States Federal Reserve does not forecast with one model; it runs an ensemble and leans on the combination. National weather services moved to ensemble forecasting decades ago, which is why a modern forecast arrives as a probability rather than a single confident line. The prediction systems now embedded in logistics, medicine and search are almost all ensembles rather than single elegant equations. In field after field where being approximately right matters more than being theoretically pure, the single best model has quietly lost to the committee of adequate ones.
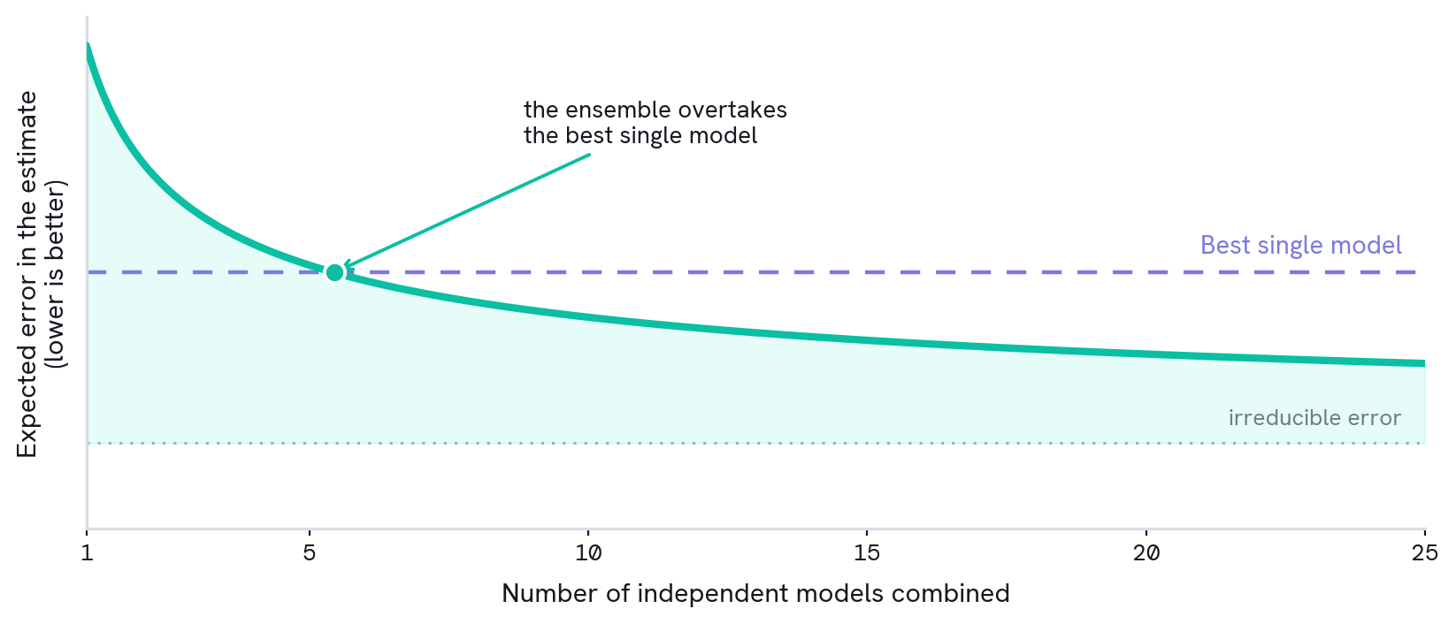
Figure 1. Why an ensemble wins. As more genuinely independent models are combined, the expected error in the estimate falls, crosses below the best single model, and flattens at a floor of error common to them all that no amount of combining can remove. Schematic illustration of the mechanism, not actual model output.
Investing is the conspicuous holdout. Much of active management is still organised around one dominant lens. A deep value house sees cheapness. A quality manager sees compounding. A momentum strategy sees trend. Each is a coherent way to read a company, and each works, right up until the market stops rewarding the thing that model measures. Charlie Munger made the warning a staple of his own case for thinking in many models at once: to the man with a hammer, everything looks like a nail. A single model does not merely miss now and then. It misses in a consistent direction, because its blind spots are structural. Its errors are correlated with themselves, which is exactly the condition that destroys the accuracy of any aggregate.
The strength of many models is that they are wrong in different directions. The value model's optimism is checked by the quality model's caution. The trend signal's late entry is offset by a valuation signal's early one. No single view runs the book, and the combined estimate sits closer to fair value than any of its parts. Diversity does the work, precisely as it does in a crowd.
In practice this means reading each company through many independent lenses at once. One asks what the business is worth on its cash flows. Another looks at the value of its assets, another at the durability of its earnings, another at the direction of its fundamentals, another at how comparable companies are priced. Each lens is a model in its own right, with its own assumptions and its own characteristic mistakes. Taken alone, any one of them can be led astray by the conditions it was not built for. Taken together with an appropriate means to extract the signal, the independent readings combine into an estimate that no single lens would have reached on its own.
The obvious worry is that combining so many views simply produces mush, an estimate that hugs the index and offends no one. It does the opposite. Combining independent models reduces error without diluting conviction. When a diverse set of models agrees that a company sits well below fair value, that agreement carries weight precisely because it has survived many independent tests, and a disciplined process acts on it consistently, without the hesitation, anchoring or story-chasing that leads a lone analyst to talk themselves out of an unpopular position. What emerges is a concentrated set of genuine disagreements with the market, reached by a method built to keep its own errors from lining up.
This is the idea Savana's active ETFs are built on. Rather than back one house view, we assemble a large and deliberately varied set of independent models derived from large data-sets and let them vote via our proprietary algorithms. In effect we construct a crowd with built-in diversity, engineered to uncover value where the market's own crowd has thinned. The discipline lies in keeping the inputs genuinely diverse and genuinely independent, so that their errors keep cancelling rather than compounding.
That discipline earns the most exactly where the market's own diversity is weakest. In the neglected end of the market, where few analysts are watching and a single story can set the price, the real crowd is small and correlated, and its collective error is large. A constructed crowd of many models is at its most valuable there, because it supplies the diversity the market is missing. It is also, as Mauboussin has long argued, where an edge is most likely to last: the rising, converging skill that has competed away so much active return has barely reached the corners no one is crowding into.
We did not arrive at this by preference. We arrived at it because the mathematics of accurate prediction points there, and because it holds outside markets as reliably as within them. The best model, it turns out, is rarely a single model at all. It is a well-built ensemble of many.
1 S&P Global. Normalised price-to-earnings ratio of the S&P Small Cap 600 as at 30 June 2026.
2 S&P Global. Forward price-to-earnings ratio of the S&P Small Cap 600 and S&P 500 as at 30 June 2026.
3 CME Group FedWatch Tool. Market-implied probabilities derived from federal funds futures pricing.
4 Bloomberg consensus estimates for the S&P Small Cap 600