
Letter to Investors - July 2026
Portfolio Overview
July was a strong month for the Savana US Small Caps Active ETF (ASX: SVNP) (the Fund), which returned 2.21% and outperformed the S&P SmallCap 600 benchmark by 5.44%.
Performance was led by standout returns from Everforth Inc. (+59%) and ManpowerGroup Inc. (+55%) following positive earnings releases. In both cases, the results challenged the market’s prevailing pessimism and triggered a rapid repricing of companies that we believed had been materially undervalued.
The month was also characterised by a considerable reversal in semiconductor-related companies. Within the S&P SmallCap 600 Index, MaxLinear Inc. (-48%), Ultra Clean Holdings Inc. (-42%), ACM Research Inc. (-38%) and FormFactor Inc. (-34%) - each of which had delivered triple-digit returns in the year to the end of June - were among the five largest detractors. Accordingly, Information Technology, the Index’s strongest-performing sector this year, declined 2.0% during July. This reversal narrowed the gap created earlier in the year as semiconductor momentum propelled the benchmark higher, even as the broader economic benefits of the AI capital expenditure boom continued to support US small-cap equities.
With the AI capital expenditure boom providing anearnings tailwind across the broader US economy, and our process continuing to uncover valuation asymmetries, we remain encouraged by the portfolio’s positioning.
Value of A$10k Since Inception
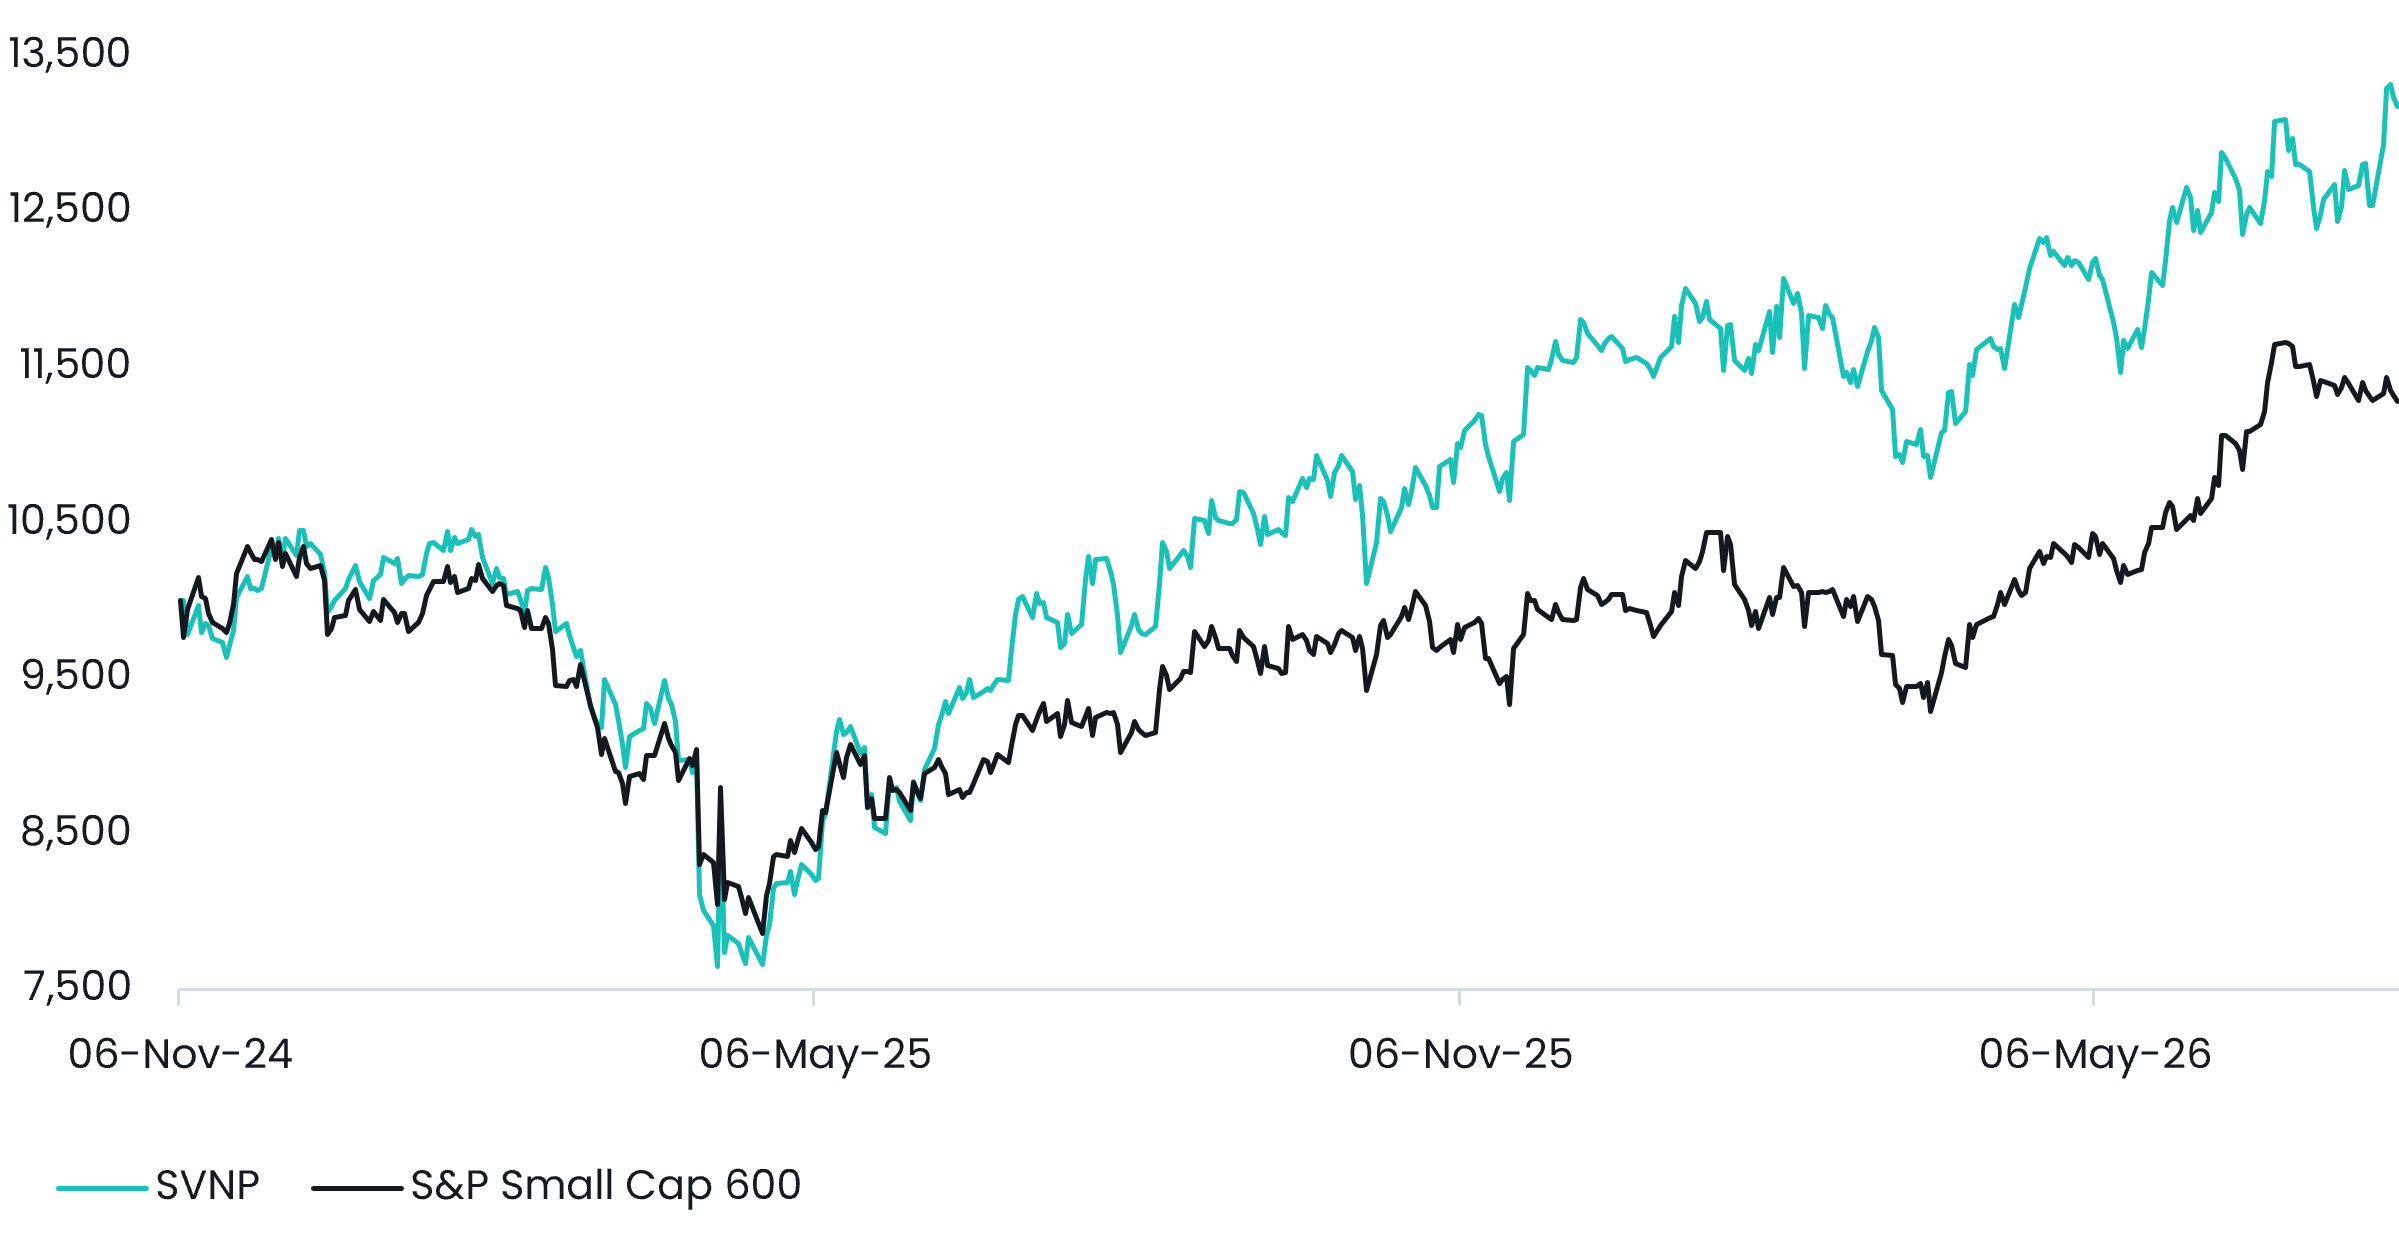
Source: Savana, S&P Global. Value of a hypothetical A$10,000 investment in SVNP since inception on 6 November 2024, based on close-of-day net asset value per unit, as at 31 July 2026. Returns are after fees and costs with dividends reinvested. Past performance is not indicative of future performance.
Trailing & Calendar Year Returns
Source: Savana, S&P Global. The Savana US Small Caps strategy was implemented on the ASX as of the 6th of November 2024. Total returns are calculated in Australian dollars based on the close-of-day net asset value per unit as at the last day of the given period. Returns are after fees and costs with dividends reinvested. Returns for periods greater than one year are annualised. ‘Relative’ figures are the arithmetic difference between the SVNP and benchmark returns shown; the ‘Since Inception’ relative figure is therefore a per-annum differential. Past performance is not indicative of future performance.
Sector Breakdown
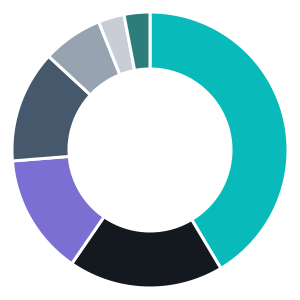
- Financials41%
- Information Technology18%
- Industrials14%
- Communication Services13%
- Consumer Discretionary7%
- Consumer Staples3%
- Health Care3%
Source: Savana as at 31 July 2026.
Top Five Exposures
Source: Savana as at 31 July 2026.
Lessons from July’s AI Sell-Off
July was defined by a significant sell-off across semiconductor and AI infrastructure companies. Casualties included SanDisk, which fell approximately 47% over the month; Intel and SK Hynix, which each declined around 35% over the month; and Micron, which fell almost 29% - with SK Hynix losing close to 15% in a single session as the rout spread through Asian markets.
July 2026 Share Price Falls: Semiconductor & Memory
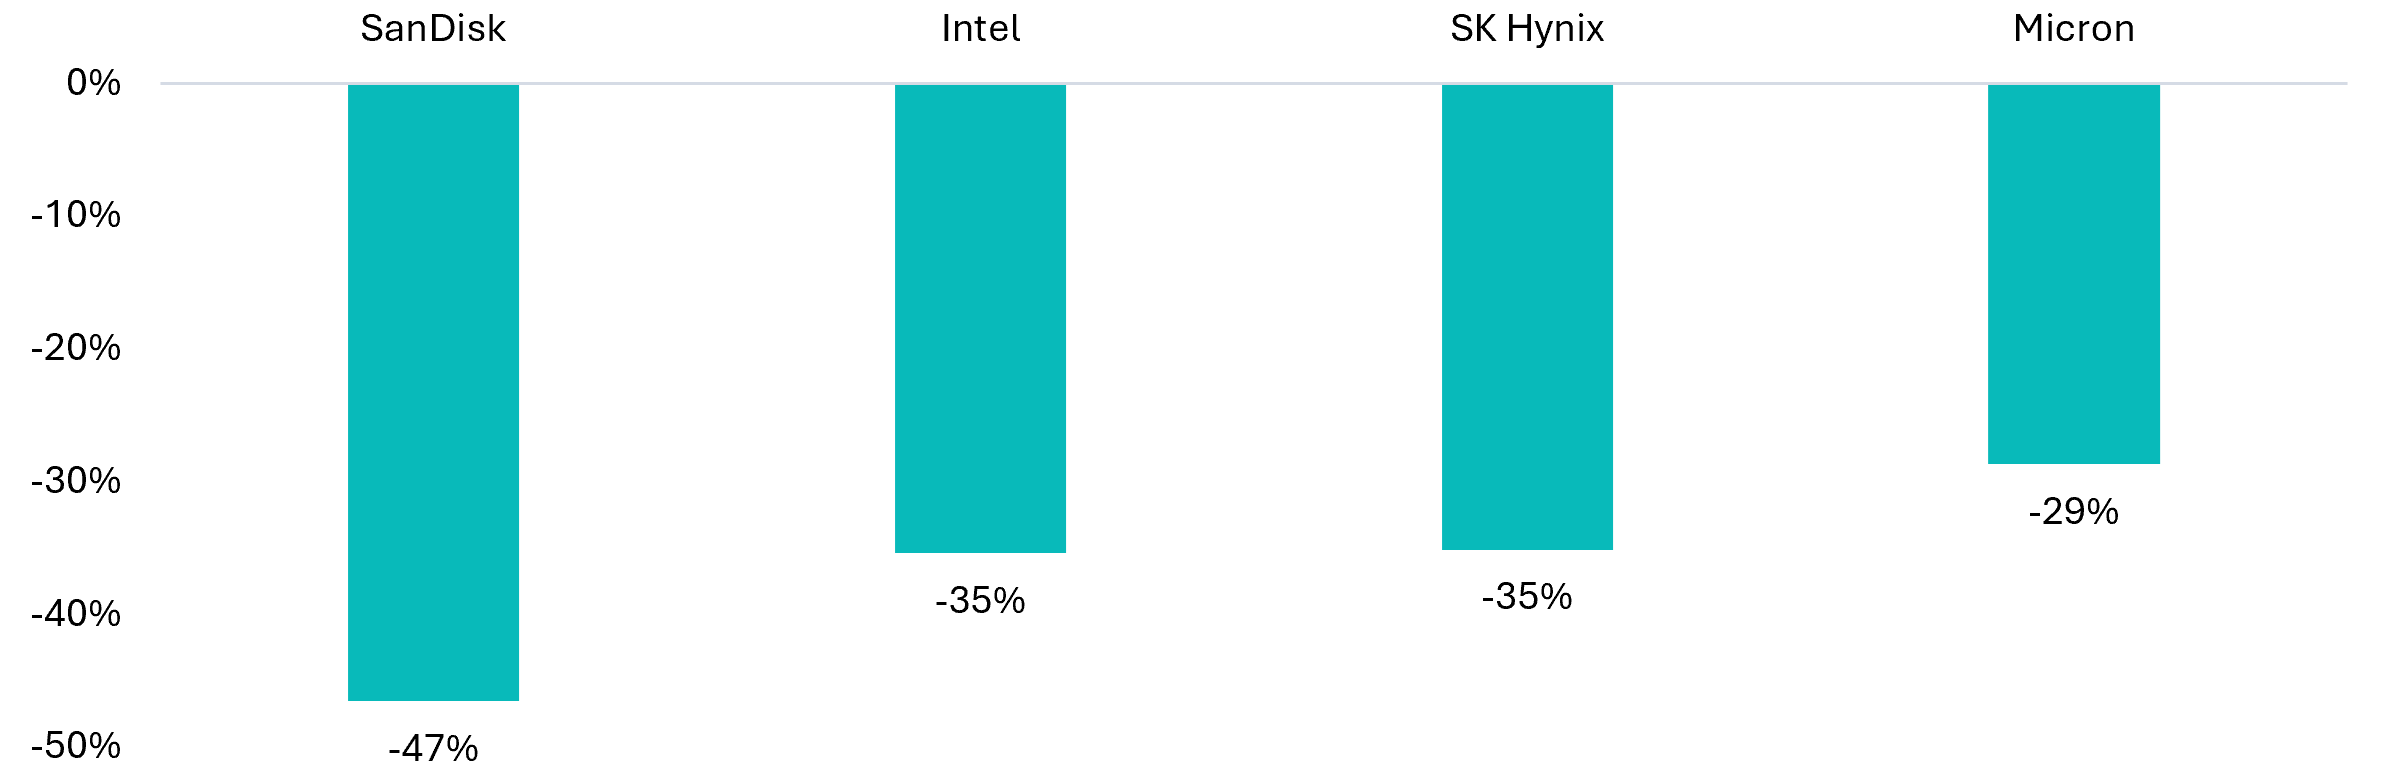
Source: S&P Global, Savana. Share price change over the month of July 2026 for selected semiconductor and memory companies.
We believe the sell-off reflected several overlapping concerns. Investors were already questioning the sustainability of the AI capital expenditure boom, the growing reliance on debt and the increasingly circular financing arrangements emerging across the sector. Sentiment weakened further following the release of Kimi K3, a low-cost, open-weight model developed by China’s Moonshot AI that demonstrated capabilities approaching those of leading American models. At the same time, advances by Chinese semiconductor manufacturers raised the prospect of greater competition and eventual oversupply in memory chips.
The episode is a stark reminder that, in modern markets, the distance between euphoria and distress can be measured in weeks. An investor who purchased SanDisk at the beginning of 2026 was still sitting on a gain of approximately 412% at the end of July. An investor who purchased it at the close on 30 June, only one month earlier, had lost approximately 47%. Both investors owned the same company and were exposed to broadly the same long-term fundamentals. The difference was timing, valuation and the market’s rapidly changing expectations.
SanDisk Share Price: January to July 2026
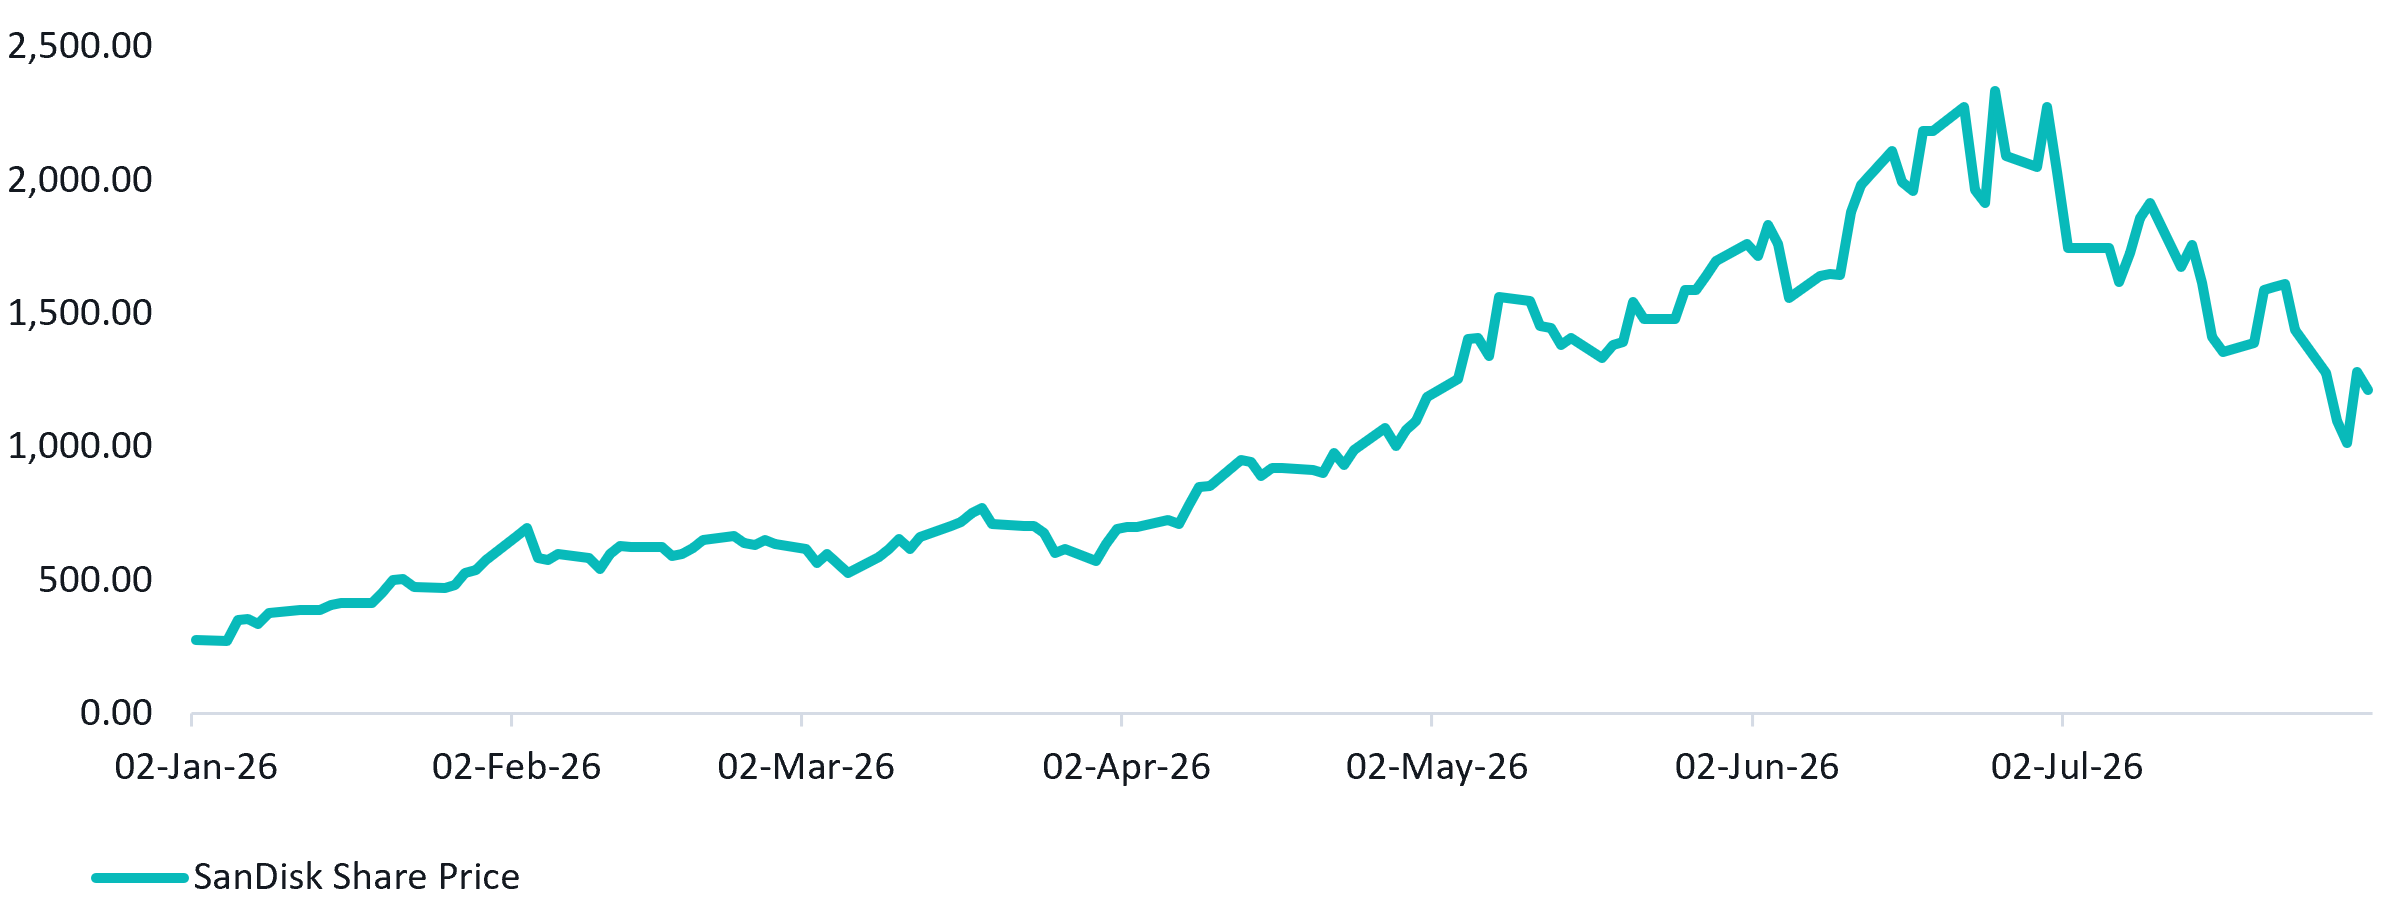
Source: S&P Global, Savana. SanDisk daily closing share price from January to July 2026.
This is not merely a lesson for individual investors, it is one that professional fund managers repeatedly relearn. A US$20bn AI-focused hedge fund, Situational Awareness, emerged in July as the latest cautionary tale. Established by 24-year-old former OpenAI researcher Leopold Aschenbrenner, the fund had generated significant returns through concentrated and leveraged exposure to companies positioned to benefit from the AI infrastructure boom. It returned 439% during the first half of 2026. In July, however, its portfolio fell 67%. As its positions moved against it, liquidity deteriorated and margin pressure intensified, forcing the fund to unwind most of its listed-equity portfolio, with Citadel purchasing a significant proportion of the assets .
This example highlights two uncomfortable realities of active funds management.
First, fund managers can deliver exceptional results, often for extended periods, simply because they are overweight the companies, sectors or themes leading the market. In these instances, it can be difficult to untangle skill from luck. Did the manager possess a genuine edge in identifying and exploiting the opportunity, or was the fund simply carrying concentrated exposure to the prevailing momentum trade?
Second, even where the position reflects genuine insight and the manager is directionally correct, the market can still move violently against it. Fundamentals and share prices do not necessarily converge within the timeframe in which a fund must meet margin calls, manage redemptions and retain investor confidence. A manager can therefore be right about the ultimate destination and still fail to survive the journey. And as the Situational Awareness example illustrates, a fund does not need to fall to zero to become commercially unviable.
At Savana, this principle is foundational. In our view, a fund manager has no choice but to be conservative in position sizing and unequivocal about diversification. Small-cap equities are volatile by nature, and that risk is precisely why the discipline matters. SVNP typically holds 30 stocks, equally weighted at each rebalance, so no position begins at more than approximately 3.33% of the portfolio. Even if a company were to fail entirely, the resulting loss would be uncomfortable but, against approximately 19% total outperformance since inception, we believe, readily absorbable. Diversification helps manage that risk but does not remove it. We are also sector and theme agnostic, leading to natural portfolio diversification. The only enduring commonality between our holdings is our assessment that their market prices do not reflect intrinsic value. This anchors the portfolio in earnings, cash flow and asset value, rather than the continued popularity of a narrative. It also creates asymmetry: where pessimism is already reflected in the price, downside may be constrained while any improvement in expectations can produce meaningful upside.
Our algorithmic process reinforces this discipline. Human managers can become attached to a thesis, resist admitting mistakes or allow successful positions to grow too large. Our algorithms apply the same rules at every rebalance - adding to positions that remain undervalued, trimming those that have appreciated and removing those that no longer qualify.
Kohl’s Corporation provides a useful example. It is the only company held continuously since SVNP’s inception in November 2024. Over that period, despite its share price rising only a modest 8%, Kohl’s has contributed 2.55 percentage points to the Fund’s 31.8% total return. We attribute this to disciplined bi-monthly rebalancing, with the algorithms adding to the position as the price fell, then trimming the holding and realising profits as it rebounded.
Kohl’s Corporation: Share Price Since Fund Inception
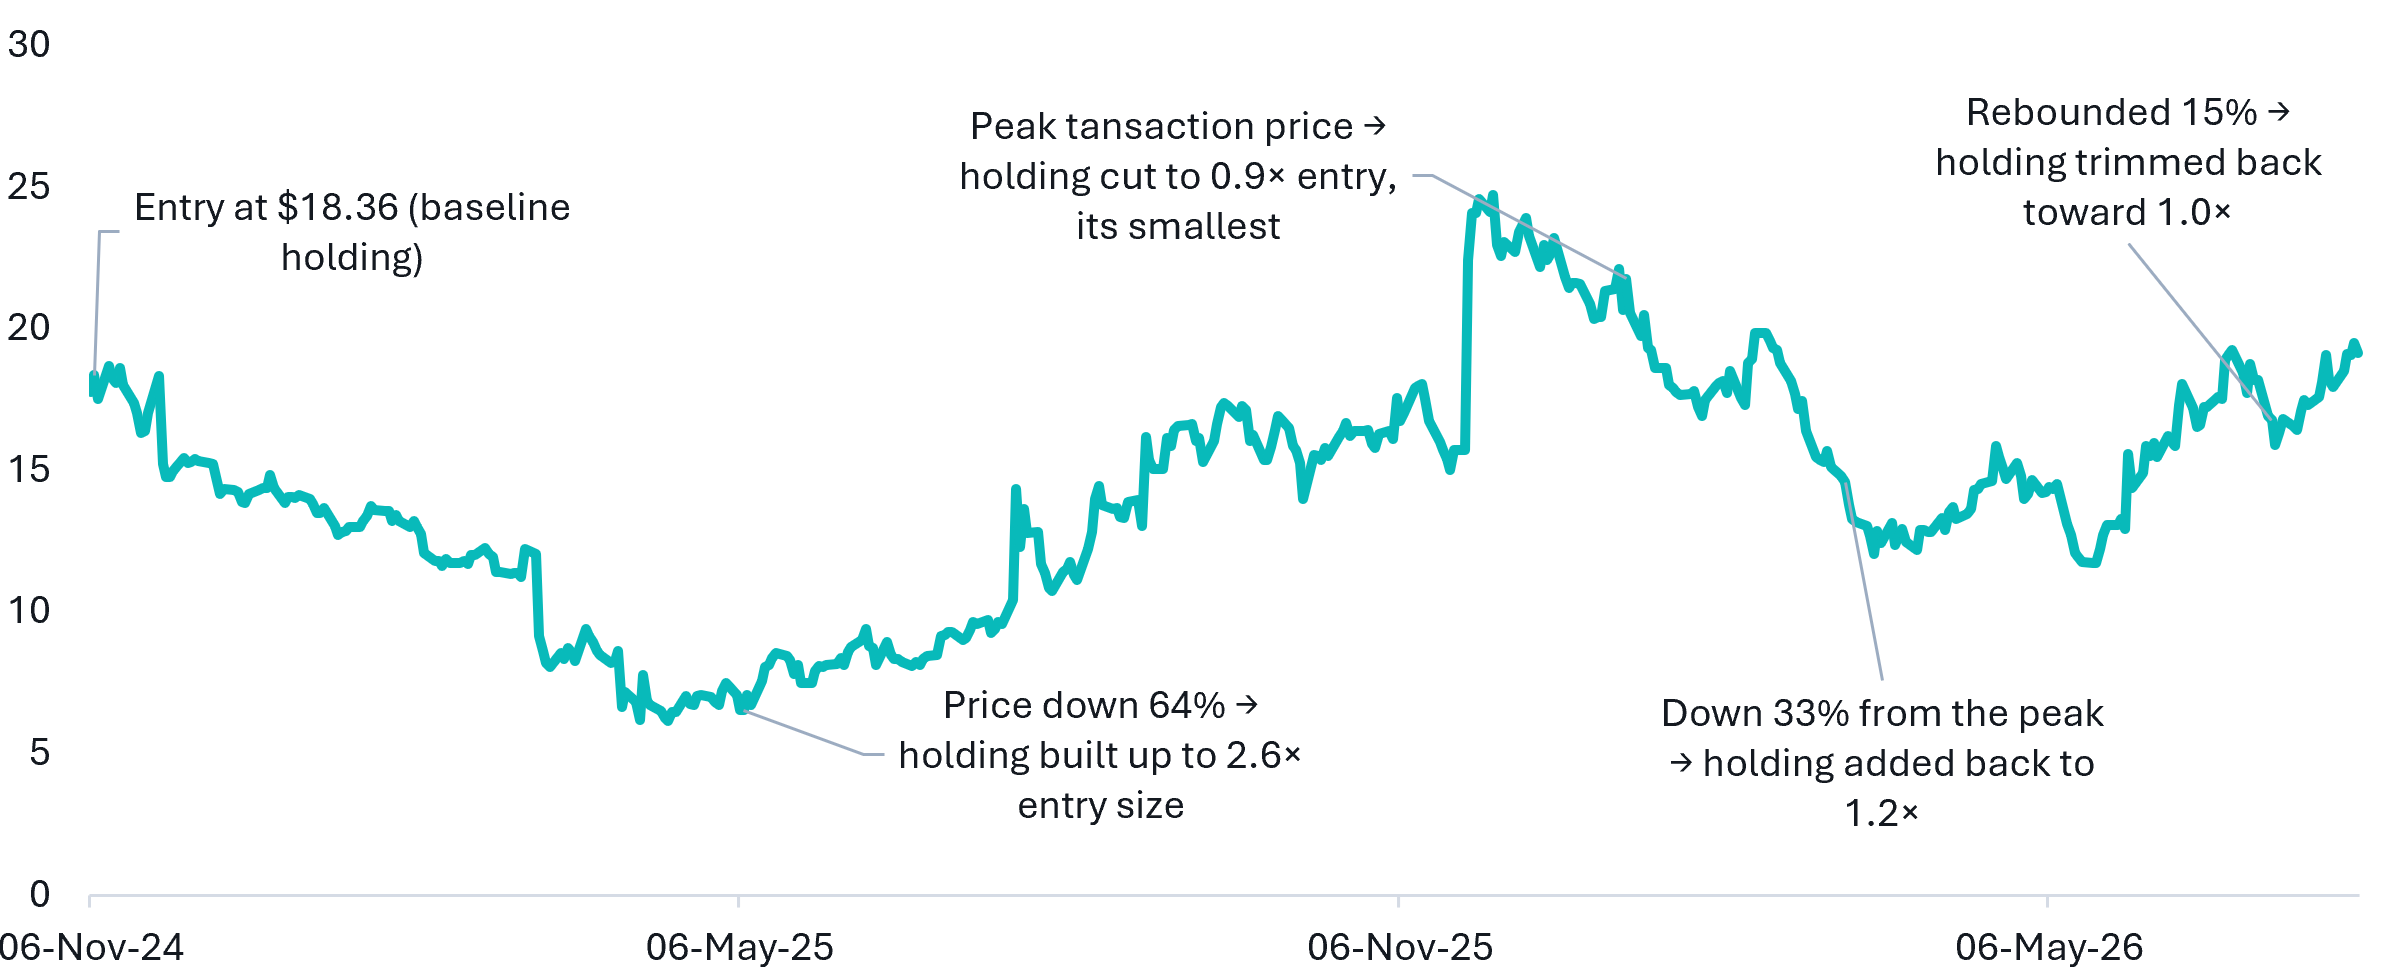
Source: S&P Global, Savana. Kohl's Corporation daily closing share price since SVNP's inception on 6 November 2024, annotated with the changes in position size made by the algorithms at each bi-monthly rebalance. Position sizes are expressed relative to the entry holding and normalised for the Fund's growth over the period, isolating the rebalancing decision from the increase in book size.
In an increasingly AI-dominated market, where innovations upheaval is causing major gyrations in market movements, disciplined portfolio construction has never been more important. Savana’s approach is designed to produce a more resilient and repeatable form of active management - one where performance reflects identifiable stock-selection skill, rather than dependence on a prevailing theme or momentum trade.
Why Investors Follow the Crowd Even When it is Wrong
The extraordinary rise - and sudden July reversal - of AI-related stocks offers a timely reminder of how quickly conviction can become crowd behaviour. With AI’s long-term economics still uncertain and reliable information limited, investors are at high risk of taking cues from price movements and the actions of others, rather than the evidence at hand. A famous social experiment by psychologist Solomon Asch reveals why this behaviour can be so dangerous…
In 1951, Asch conducted one of the most revealing experiments in social science. Participants were shown a target line alongside three comparison lines and asked a remarkably simple question: which comparison line was the same length as the target?
The Asch Conformity Task

Source: Asch (1951). Illustration of the visual comparison task used in Asch’s conformity experiments: participants were shown a target line (left) and asked which of the three comparison lines (right) matched its length.
The correct answer was usually obvious. Yet the experiment contained a critical twist. Unbeknownst to the real participant, the other members of the group were actors instructed to provide the same incorrect answer. Faced with a choice between their own observation and the apparent consensus of the room, participants conformed to the incorrect group judgment on 36.8% of the critical trials. Interestingly still, the effect strengthened rapidly as the group expanded. With one actor, conformity was approximately 3%. With two, it rose to 13.6%. With three, it reached 33%, before largely levelling off.
We believe financial markets replicate this mechanism at institutional scale. Investors do not form opinions in isolation. They observe share prices, analyst forecasts, fund positioning, media narratives and the behaviour of other market participants. Each may contain useful information, but together they can reinforce the same prevailing consensus.
As more investors adopt a particular view, that view can begin to validate itself. Rising prices attract attention and encourage further buying. Falling prices generate negative commentary, increase perceived risk and prompt additional selling. What begins as an investment judgment can become accepted as fact, not necessarily because the evidence has strengthened, but because so many others appear to believe it.
This creates a difficult tension. Investors are asked to decide not only whether their analysis is correct, but whether they are prepared to disagree with the market. Taking a contrary position can feel uncomfortable, financially costly and professionally risky. A conventional mistake made alongside everyone else is often easier to explain than an unconventional mistake made alone.
In Asch’s experiment, participants were deciding which line was longer. In markets, the questions are far more difficult. What is a company worth? Are its problems temporary or permanent? Is recent growth sustainable? Has the market already priced in the risks? When the answers are uncertain, the gravitational pull of consensus becomes stronger.
Consensus itself is not inherently irrational. Markets aggregate enormous amounts of information, and the prevailing view is frequently correct. The problem emerges when confidence in that view becomes detached from the underlying evidence. When investors converge too strongly around the same assumptions, cognitive diversity begins to break down and prices can diverge from intrinsic value.
Positive expectations may become embedded in a share price with little allowance for disappointment. Conversely, companies facing well-understood challenges can be valued as though those problems will persist indefinitely, with little recognition that conditions may improve. At these extremes, investors are no longer simply assessing value. They are extrapolating the prevailing narrative.
In our view, this helps explain how markets can be highly efficient while remaining periodically prone to substantial mispricing. Prices may incorporate information quickly, but the people interpreting that information remain vulnerable to social influence, recency bias, fear, overconfidence and the instinct to seek safety in numbers.
This is where a systematic investment process can provide a distinct advantage. It applies the same valuation discipline whether a company is fashionable, overlooked or deeply unpopular. It is not influenced by the discomfort of disagreeing with the crowd, nor does it mistake the strength of consensus for the strength of the evidence. At Savana, this discipline helps us distinguish between businesses that are genuinely impaired and those whose share prices reflect a level of pessimism the fundamentals do not support.
This material is for information purposes only and has been prepared for both retail and wholesale investors. It is not an offer or a recommendation to invest. No representation is made as to future performance or volatility of the investment, and there is no guarantee that the investment objectives or strategy will be successful. Any forward-looking statements, opinions and estimates are based on assumptions and contingencies which are subject to change without notice. No representations or warranties, expressed or implied, are made as to the accuracy or completeness of the information contained in this document. In preparing this document, we have relied upon and assumed, without independent verification, the accuracy and completeness of all information available to Savana. Persons should rely solely upon their own investigations in respect of the subject matter discussed. To the maximum extent permitted by law, all liability in reliance on this document is expressly disclaimed.
This material may not be reproduced, distributed or published, in whole or in part, without the prior approval of Savana. There are risks associated with an investment in the Savana US Small Caps Active ETF (SVNP), including active management risk, market risk, currency risk, concentration risk, liquidity risk and model risk. Investment values may rise and fall, and past performance is not indicative of future performance. This material has not been prepared taking into account your objectives, financial situation or needs. An investment in SVNP should be considered as part of a broader portfolio, having regard to your individual objectives, financial situation and needs, including your tolerance for risk. Before making an investment decision, you should consider the Product Disclosure Statement (PDS) and Target Market Determination (TMD), available at www.savana.ai.
More from Insights


Subscribe for Monthly Updates