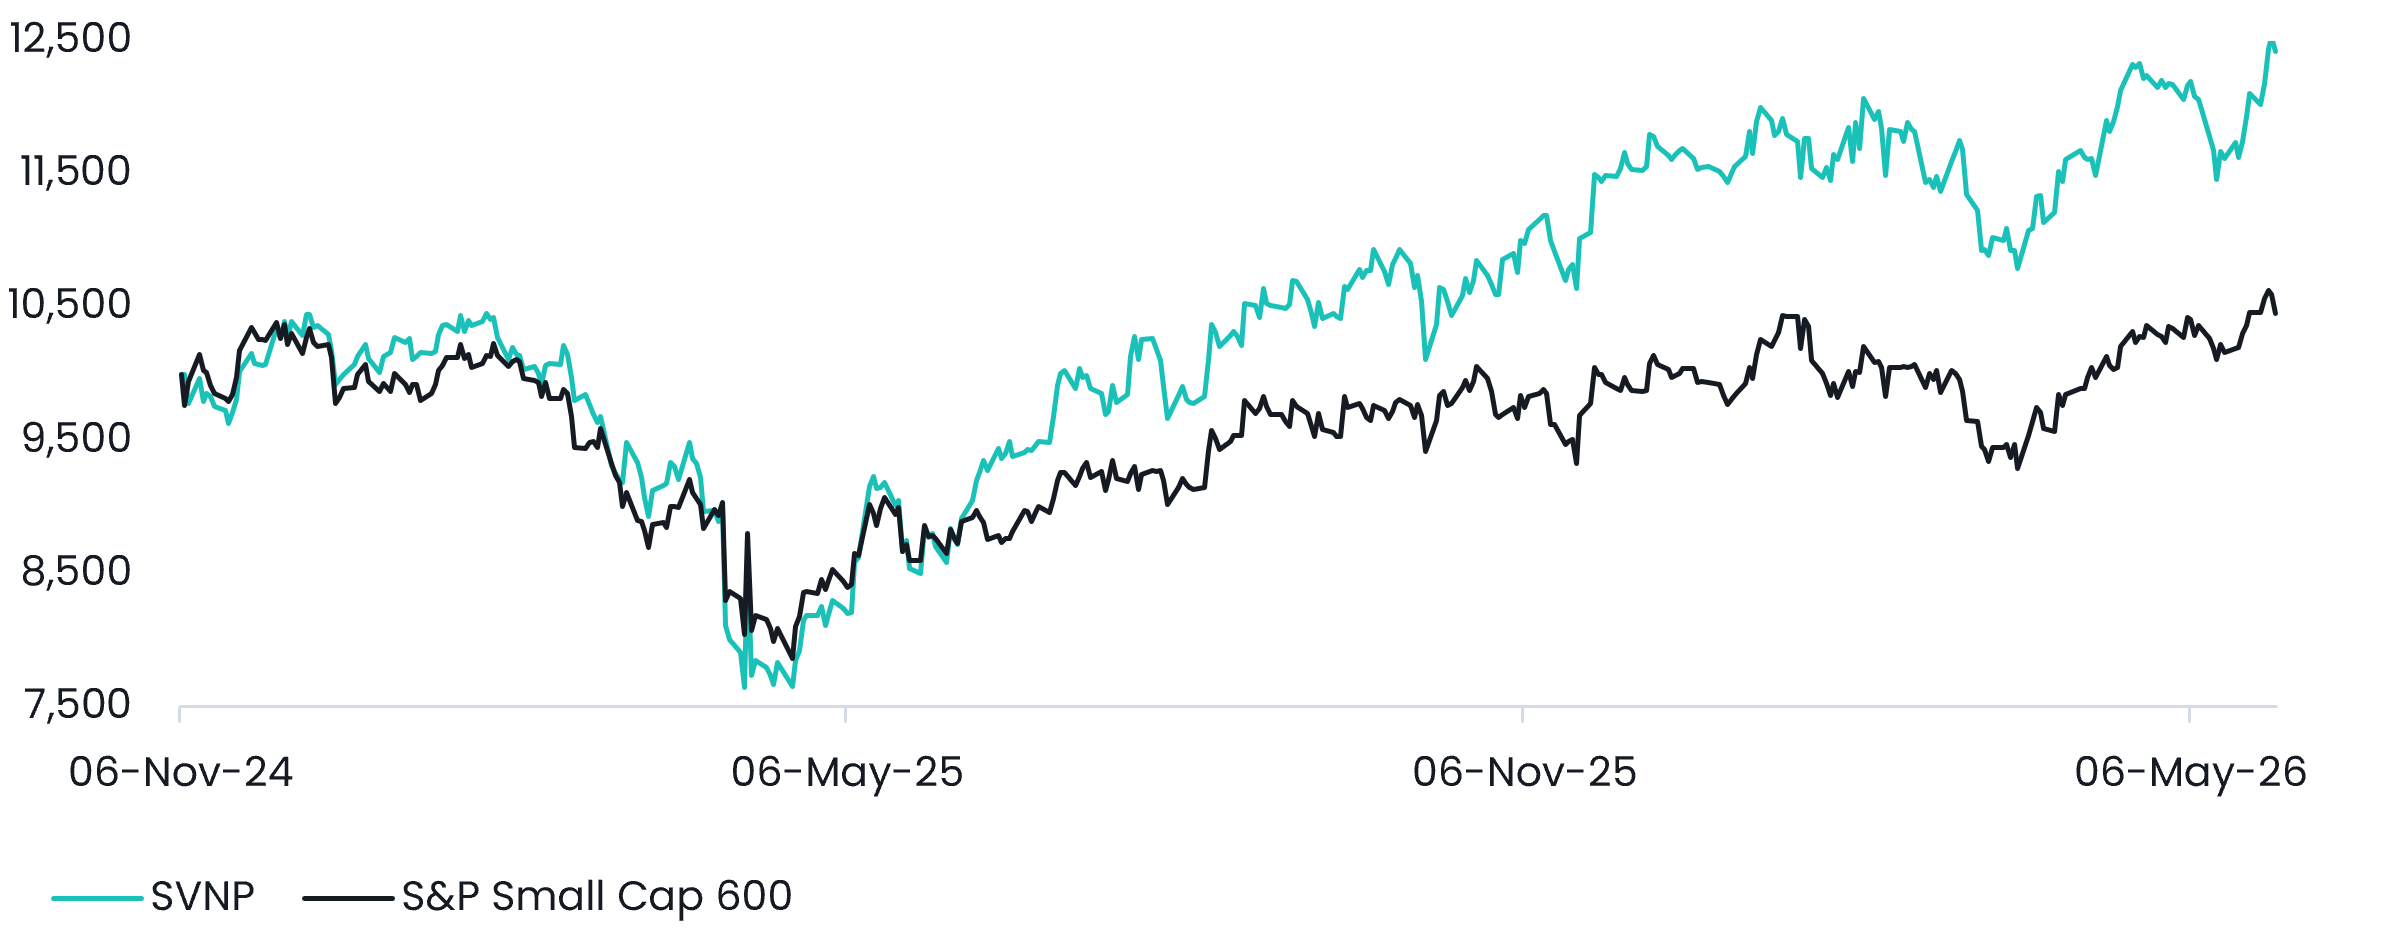
The Savana US Small Caps Active ETF (ASX:SVNP) returned +1.97% in May, representing a +1.01% outperformance of the S&P Small Cap 600 benchmark. Performance was driven by several standout contributors, including Versigent PLC (+26%), Taboola.com Ltd (+30%) and Insight Enterprises Inc. (+46%). SVNP has now outperformed the S&P Small Cap 600 in 12 out of the last 13 months.
Value of A$10k Since Inception
Trailing & Calendar Year Returns
Source: Savana, S&P Global. The Savana US Small Caps strategy was implemented on the ASX as of the 6th of November 2024. Total returns are calculated in Australian dollars based on the close-of-day net asset value per unit as at the last day of the given period (as at 31 May 2026). Returns are after fees and costs with dividends reinvested. Returns for periods greater than one year are annualised. ‘Relative’ figures are the arithmetic difference between the SVNP and benchmark returns shown; the ‘Since Inception’ relative figure is therefore a per-annum differential. Past performance is not indicative of future performance.
Sector Breakdown
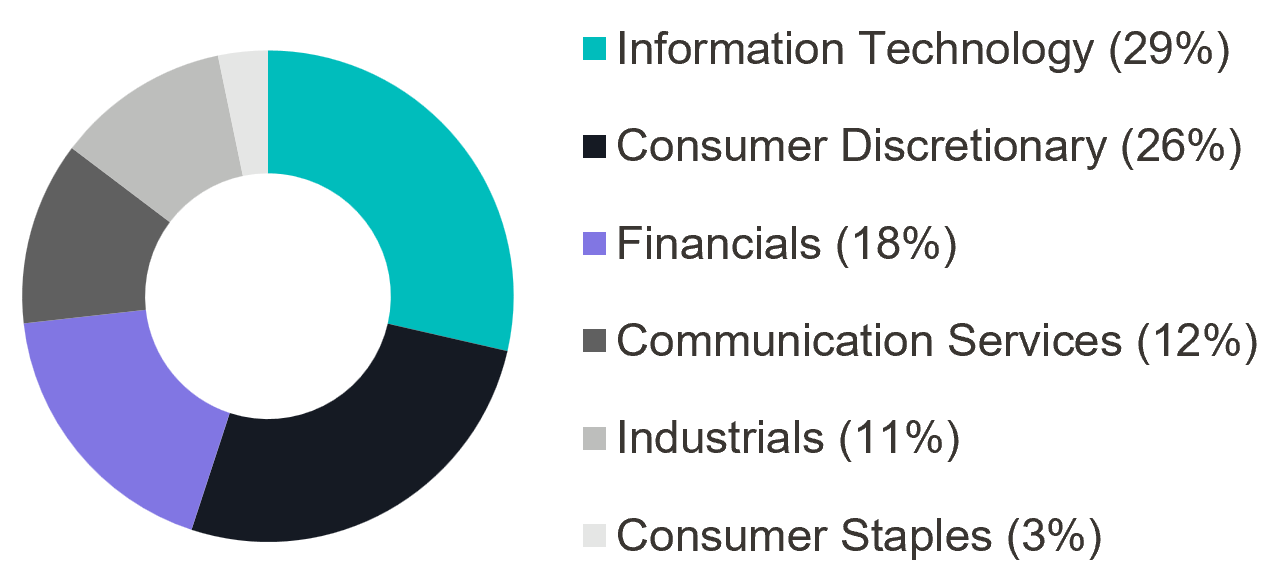
Top 5 Exposures
The May result provides a useful lens through which to consider two broader themes that remain central to Savana’s investment case: the continued evidence supporting our Collective Intelligence approach to markets, and the increasingly compelling opportunity set in US equities.
At the portfolio level, SVNP’s performance reflects the application of a disciplined, systematic process to a part of the market where mispricing remains unusually fertile. At the market level, the contrast between the US and Australia has become increasingly difficult to ignore. To the end of May, the S&P Small Cap 600 benchmark was up approximately 14% year-to-date in USD terms, while the ASX 200 was exactly flat over the same period in AUD terms.
The sections that follow examine these themes from two perspectives. First, Markets are Wise, but not Always revisits the core intellectual foundation of Savana’s philosophy: that markets are powerful information-processing systems, but only under certain conditions. Second, A Barbell for the US Market considers how investors might think about US equity exposure today, particularly in a market where mega-cap technology continues to dominate the index, while profitable small caps remain deeply discounted and comparatively under-owned.
The stock market is the largest crowd there is, but like any crowd it is wise only under certain conditions. Understanding those conditions explains both why markets are so hard to beat and where they remain predictably beatable.
Most active managers start with the premise that the market is wrong, and they know better. We think that is backwards. The more useful starting point, and the one that we have been researching for the better part of a decade, is that the market is usually right, that this is no accident, and that understanding precisely why it is right tells you where and when it is likely to be wrong.
The reason markets are so hard to beat is not mysterious. It is the same reason a crowd at a country fair can guess the weight of an ox more accurately than the prize cattle judge, the example Francis Galton documented in 1907 1. The stock market is a crowd of the same kind, only vastly larger. Millions of participants, each with their own information, methods and biases, buy and sell in response to new information. Those independent judgements aggregate into a single price, and the errors in them, the optimism of one, the pessimism of another, tend to cancel. What survives is something close to fair value. This is the mechanism beneath the Efficient Market Hypothesis, and it works.
What is less widely appreciated is that this accuracy is not a permanent property of markets. It is a conditional one. And that condition can be written down as a simple equation.
In 2007 the University of Michigan and Santa Fe Institute complexity scientist Scott E. Page formalised the wisdom of crowds into a mathematical identity he called the Diversity Prediction Theorem 2. It states that a group’s collective error equals the average error of its individual members minus the diversity of their predictions. Page writes it simply: collective error equals average individual error minus prediction diversity. The implication is profound and slightly counterintuitive. A crowd’s accuracy does not come only from the skill of its members. It comes, in equal measure, from how much they disagree. Diversity is not a nice-to-have that makes a group feel balanced. It is a critical condition for ensuring accurate decision making.
Page’s larger body of work, summarised in The Difference (2007)3, makes the point sharper still. He argues that the strength of a crowd lies in what he calls many-model thinking: the fact that different people bring different perspectives and genuinely different ways of interpreting the same problem. One investor looks at cash flows, another at price momentum, another at industry structure, and another at sentiment. Because their models and their thinking are different, their errors point in different directions, and the disagreement itself does the work of cancelling those errors out. As Page puts it, when a problem is hard, you are better off listening to people who think differently from you, even when they are individually less accurate. It is the variety of the models, not the brilliance of any one model, that produces the wise result.
Diversity Prediction Theorem in Action
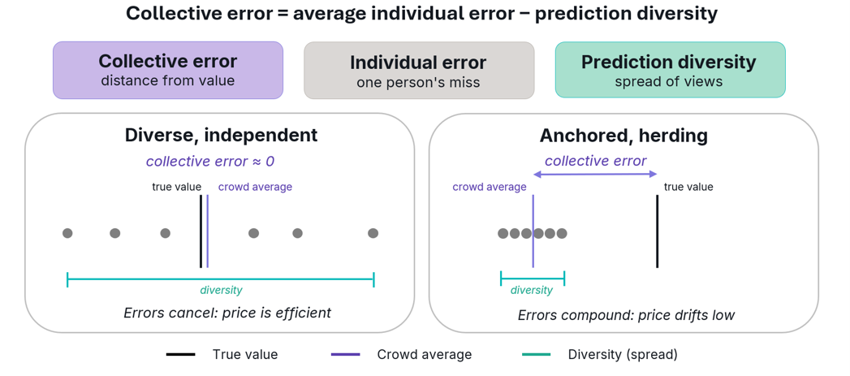
The Diversity Prediction Theorem. A crowd’s collective error equals its members’ average error minus the diversity of their views. When views are diverse and independent (left), the errors offset and the crowd average sits close to the true value. When the crowd anchors and herds (right), the spread of views collapses, errors compound, and the average drifts away from true value.
This reframes market efficiency in a way we find far more useful than the textbook version. Efficiency is not a switch that is permanently on. It is an emergent property of a system that happens, most of the time, to satisfy two conditions: a genuine diversity of independent views, and enough of them. When those conditions hold, prices are accurate and the market deserves the deference passive investing pays it. The corollary is the part that matters. When either condition weakens, the theorem says the collective error must rise. Efficiency degrades not because participants become foolish, but because their judgements stop being independent and their models stop being diverse. The disagreement that was doing the work disappears, and price drifts away from value.
Markets supply no shortage of examples. Herding, feedback loops and the familiar oscillation between fear and greed all do the same thing in the language of the theorem: they collapse diversity by making everyone’s errors point the same way. Correlated error is the enemy of an accurate crowd, and the conditions that produce it are not evenly spread across a market. They cluster.
This is where the abstract becomes practical. If the wisdom of a crowd depends on the diversity and independence of its participants, then the parts of the market with the deepest, most varied and most independent participation should be the most efficiently priced, and the parts where participation is thin, correlated or narrative-driven should be the least. The largest companies in the world are followed by thousands of analysts and investors applying every conceivable model. That crowd is enormous and diverse, and the theorem says it should be accurate. We agree. Our research shows that the largest companies tend to almost always be fairly valued, and the concentration of capital into them is not the same thing as their price being wrong.
The opportunity sits at the other end. In the neglected corners of the market, where fewer participants are watching, where a single story can dominate what little attention there is, the diversity term in Page’s identity is small, and collective error is correspondingly larger. This describes the market for small caps almost perfectly. Looking at the US market specifically, small caps currently trade at one of the widest valuation discounts to large caps in more than two decades, by some measures their cheapest relative position since the late 1990s, and as a share of the total US market they have shrunk to around 5 per cent against a long-run average closer to 8 per cent. None of that guarantees a near-term rebound. But it is precisely the environment the theorem predicts will be inefficiently priced, and therefore precisely where disciplined security selection can uncover opportunities to outperform.
Relative Valuations of Small and Large Cap Companies
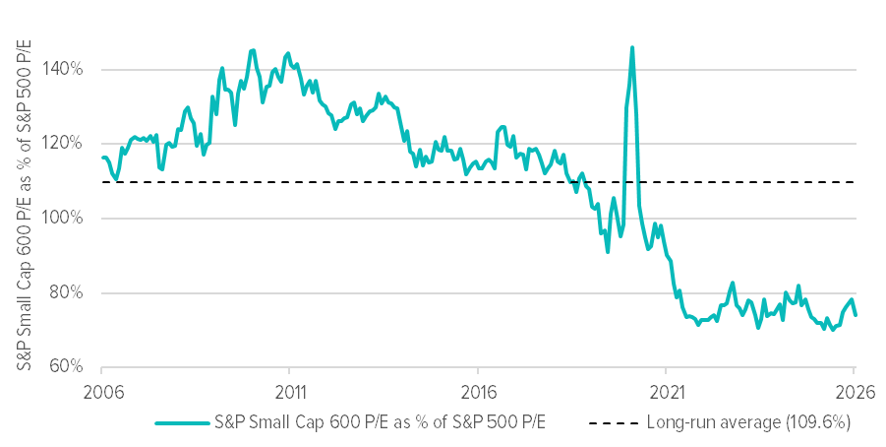
Source: S&P Global, Savana. US small-cap valuation relative to large caps. The S&P 600 forward P/E as a percentage of the S&P 500 forward P/E. Profitable small caps have swung from a long-run slight premium to one of their steepest discounts in two decades.
This is the science Savana is built on. We do not try to outsmart the crowd, because most of the time it cannot be outsmarted. We study it. Our work is to identify, systematically and without sentiment, the specific moments and segments where diversity and independence have eroded, where the theorem says the crowd has stopped being wise, and to act where the distance between price and fair value is widest. In a market as broad as the US, those gaps are not hard to locate. They are simply unfashionable, and in our experience unfashionable is usually where the work pays off.
A case for building US equity exposure at the two ends of the market, large-cap technology and discounted small caps, rather than through the crowded middle.
The domestic conversation has turned this year to whether Australia is becoming a harder place to invest. The capital gains tax discount is under review for the first time in a generation, inflation has stayed stickier than the prior decade trained investors to expect, and productivity has been close to flat for years. The local market compounds the problem: heavily weighted to banks and resources, and light on the innovation and structural growth that has driven returns elsewhere. For an investor deciding where to put new capital, the more useful question is comparative, and on the evidence the answer remains the United States. The harder question is how to own it.
In our view, the case for the US itself is well established and durable. It has the deepest and most liquid capital market in the world and the largest pool of investable risk capital, supported by the world’s leading venture and research ecosystems. The depth is not abstract: in June 2026 SpaceX raised around US$75 billion at a valuation near US$1.75 trillion 4, the largest public listing on record, the kind of risk capital that forms and lists in the United States in a way it does almost nowhere else. New business formation and capital investment per worker run well ahead of most of the developed world, and where productivity growth has stalled across advanced economies the US has continued to pull ahead. None of this depends on a particular administration or a single quarter. It is structural, and it is why returns have compounded there over long periods. The question is not whether to have US exposure, but how to hold it.
The default answer, a broad market-cap-weighted index, is no longer as neutral as it sounds. A handful of mega-cap technology companies now make up an unusually large share of the major US indices, so the “diversified” index is in practice a concentrated bet on a small number of very large stocks. At the same time, the long record of active managers failing to beat those same indices is well documented 5. That leaves an investor caught between a concentrated passive bet and active management that mostly underperforms. A barbell answers the two halves of the market separately, because they are not the same problem.
At one end are the largest companies, the mega-cap technology names that have led the market. They are exceptional businesses with real structural growth, and they are also the most heavily analysed securities in the world, followed by thousands of professionals applying every available method. On this point Savana’s work agrees with the consensus: by the time a company is this large and this scrutinised, its price already reflects most of what is knowable about it. That leaves little room to add value through selection among names the whole market is watching. The approach this end calls for is low-cost access to the growth, not an expensive attempt to out-think a well-informed crowd.
At the other end the conditions are reversed. Small companies are the real engine of new business formation, yet they receive a fraction of the coverage. That neglect shows up in price. US small caps trade at one of their widest discounts to large caps in more than two decades, on some measures their cheapest relative level since the late 1990s, and they have shrunk to around five per cent of the total US market against a long-run average closer to eight. Thin coverage is exactly where price tends to drift from value, and where disciplined selection has the most to work with.
S&P 500 Concentration: The Top 10 Share
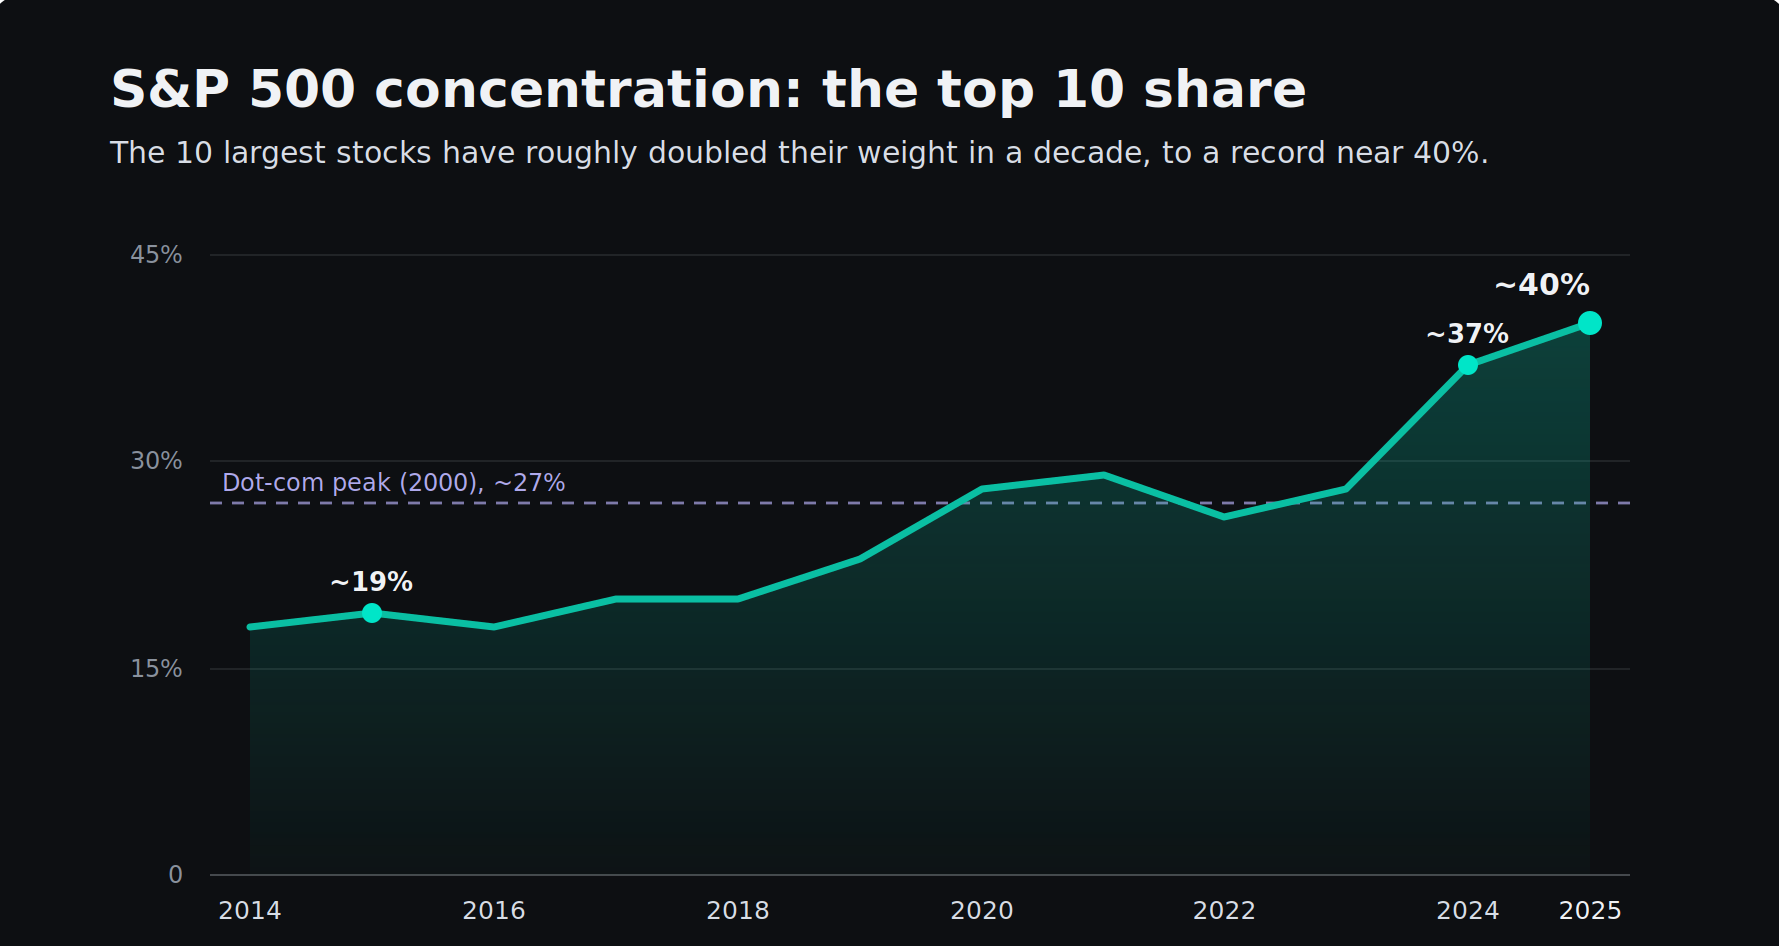
Source: S&P Dow Jones Indices, Morningstar, RBC, Savana. Top 10 stocks as a share of the S&P 500 by market capitalisation, year-end. Their weight has roughly doubled in a decade to a record near 40%, above the dot-com peak. Separately, the largest names drove around 60% of the index’s total return in 2023 and 2024.
Forward P/E: Large v Small Caps
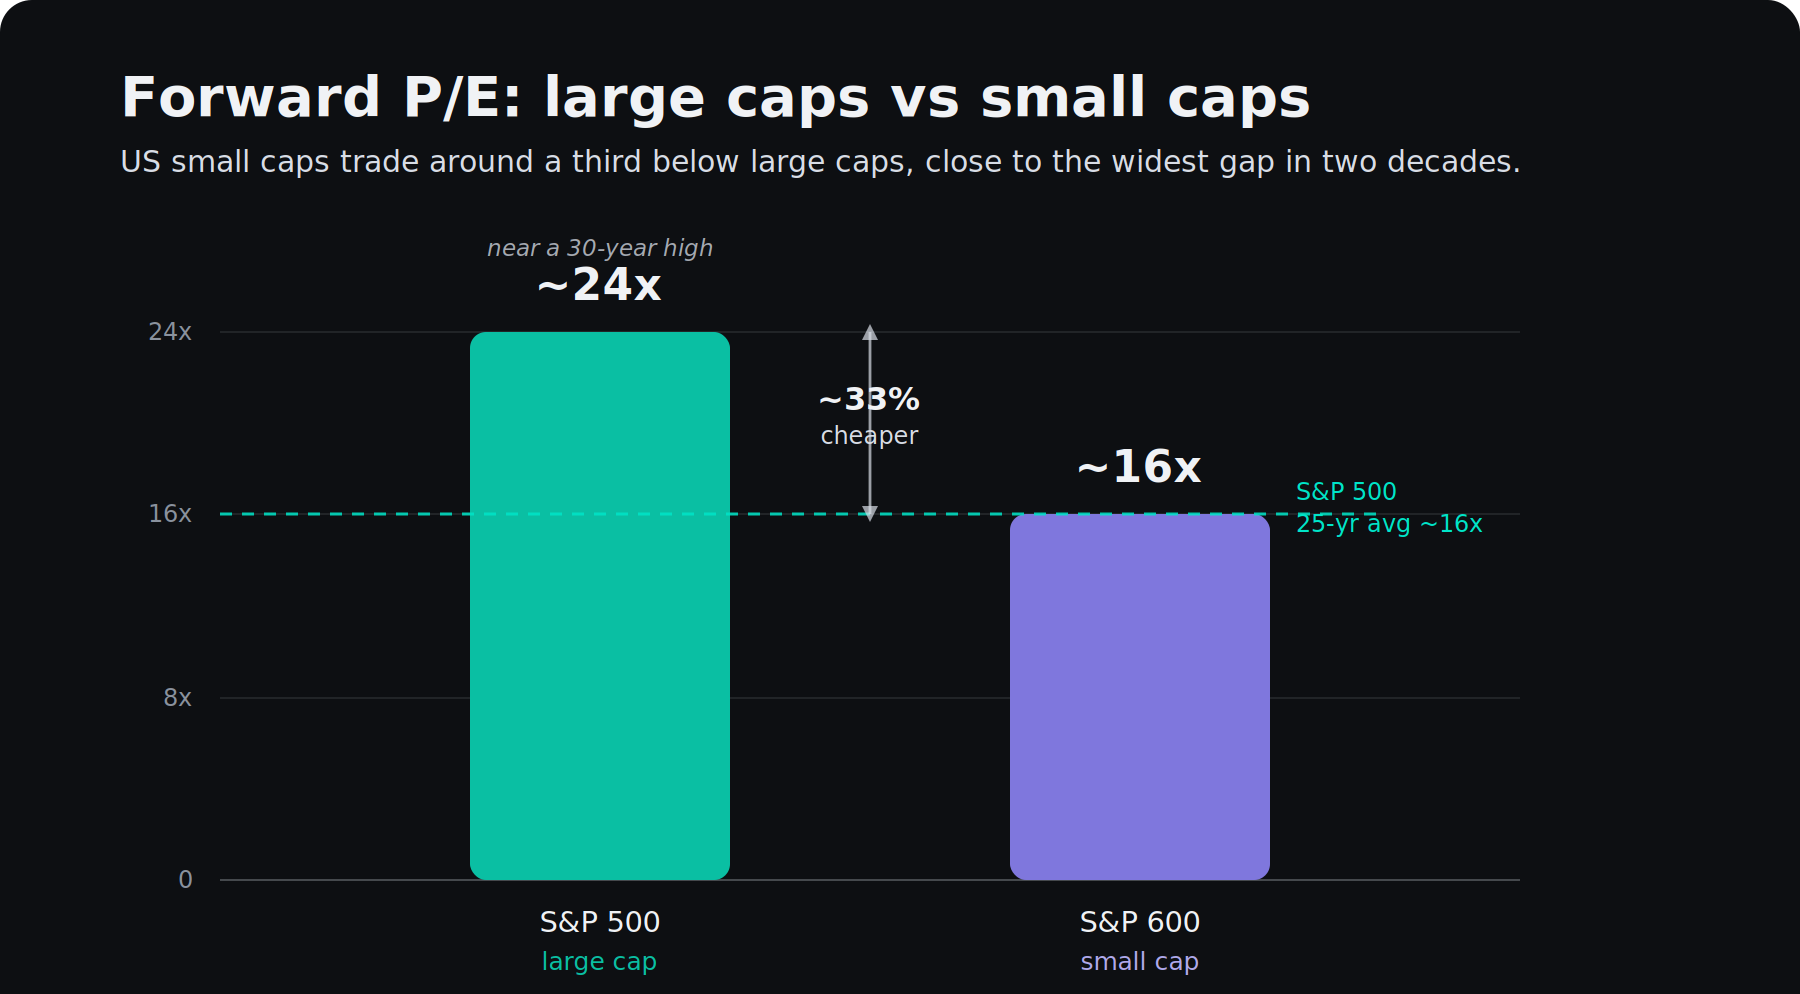
Source: S&P Dow Jones Indices, Savana. Forward 12-month P/E. The S&P 500 trades near a 30-year high at around 24 times forward earnings, while the quality-screened S&P 600 sits near 16 times, roughly a third lower and close to the widest relative discount in two decades.
Between the two sits the rest of the market. It is neither cheap enough to reward close selection nor so efficiently priced that index ownership is the obvious low-cost choice, yet it absorbs most capital by default. A barbell is simply the decision to weight the two ends and hold less of that middle.
The US Barbell
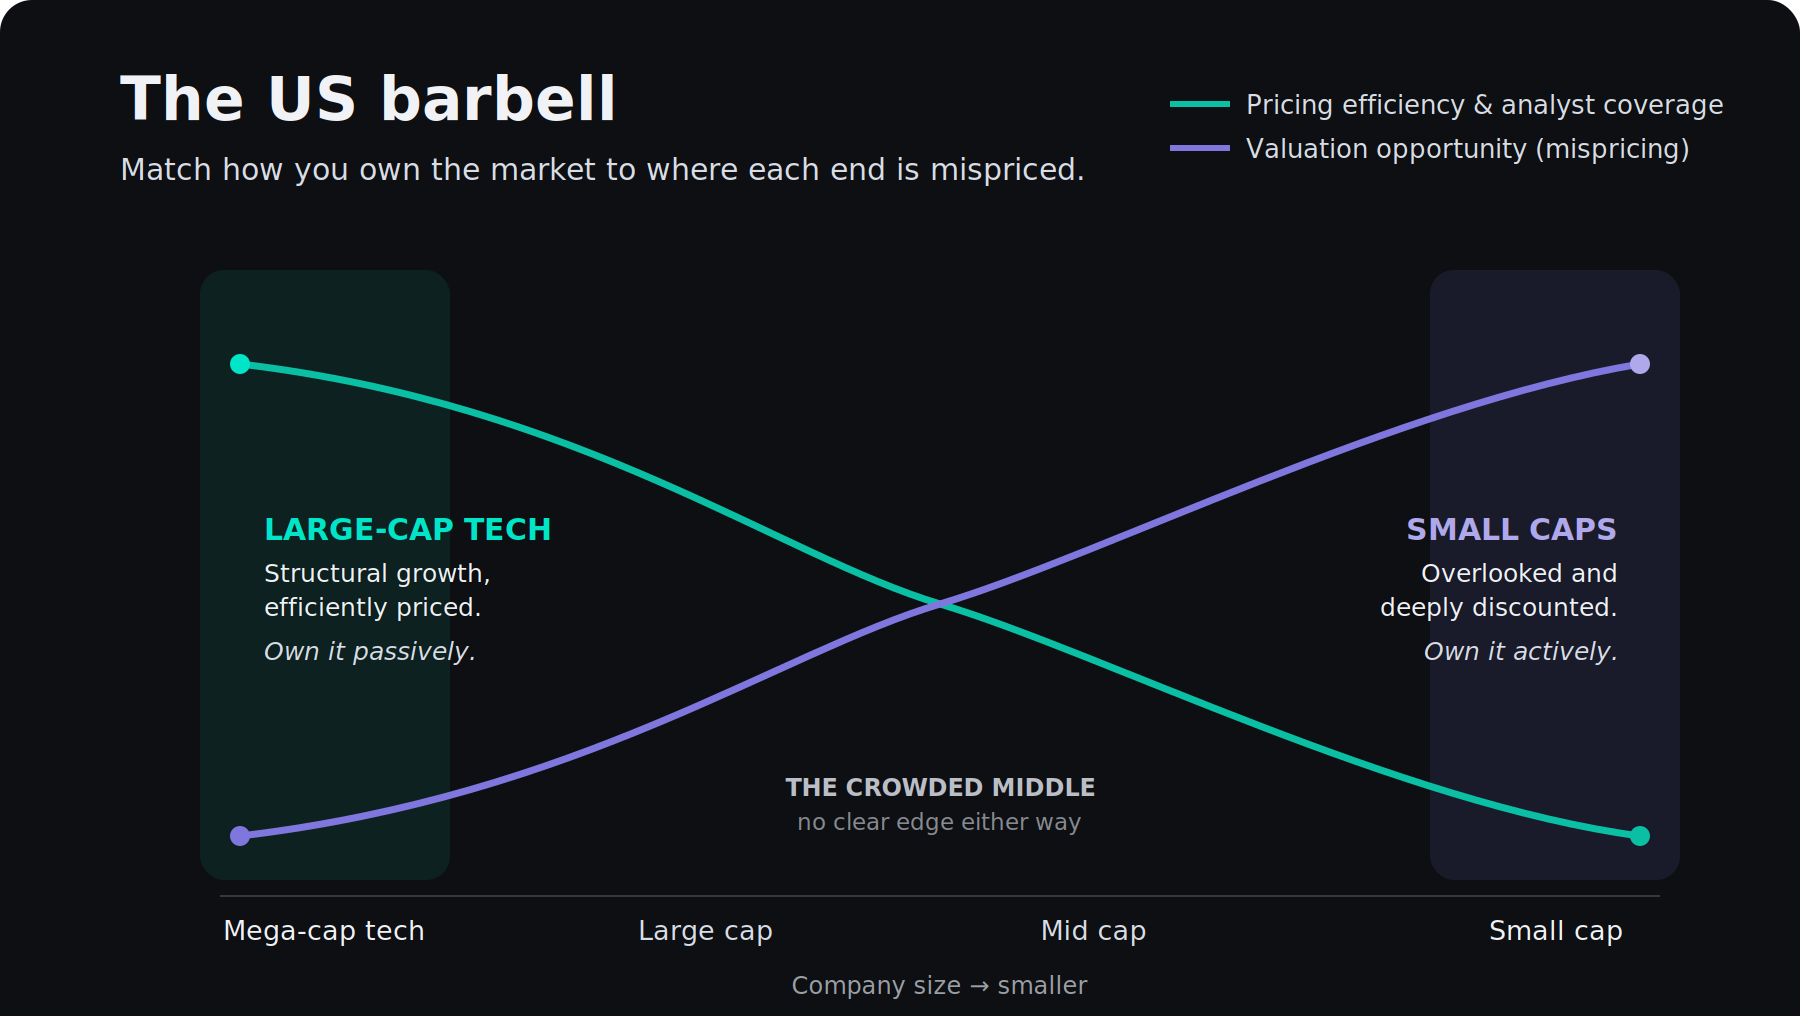
Pricing efficiency and analyst coverage are highest among the largest companies and fall as company size falls; the valuation discount runs the other way and is widest in small caps. The two ends call for different approaches.
We believe the two ends are driven by different things. Large-cap technology follows the path of secular growth; small caps follow value and the slow return of attention. Over the period since SVNP listed, US small caps and the NYSE FANG+ Index carried a correlation of about 0.6, low enough that holding both reduced the volatility of the combination below either on its own. The two are not the same bet: they tend to lead at different points in the cycle, and the returns they produce do not arrive at the same time or for the same reasons.
Combining the Two Ends
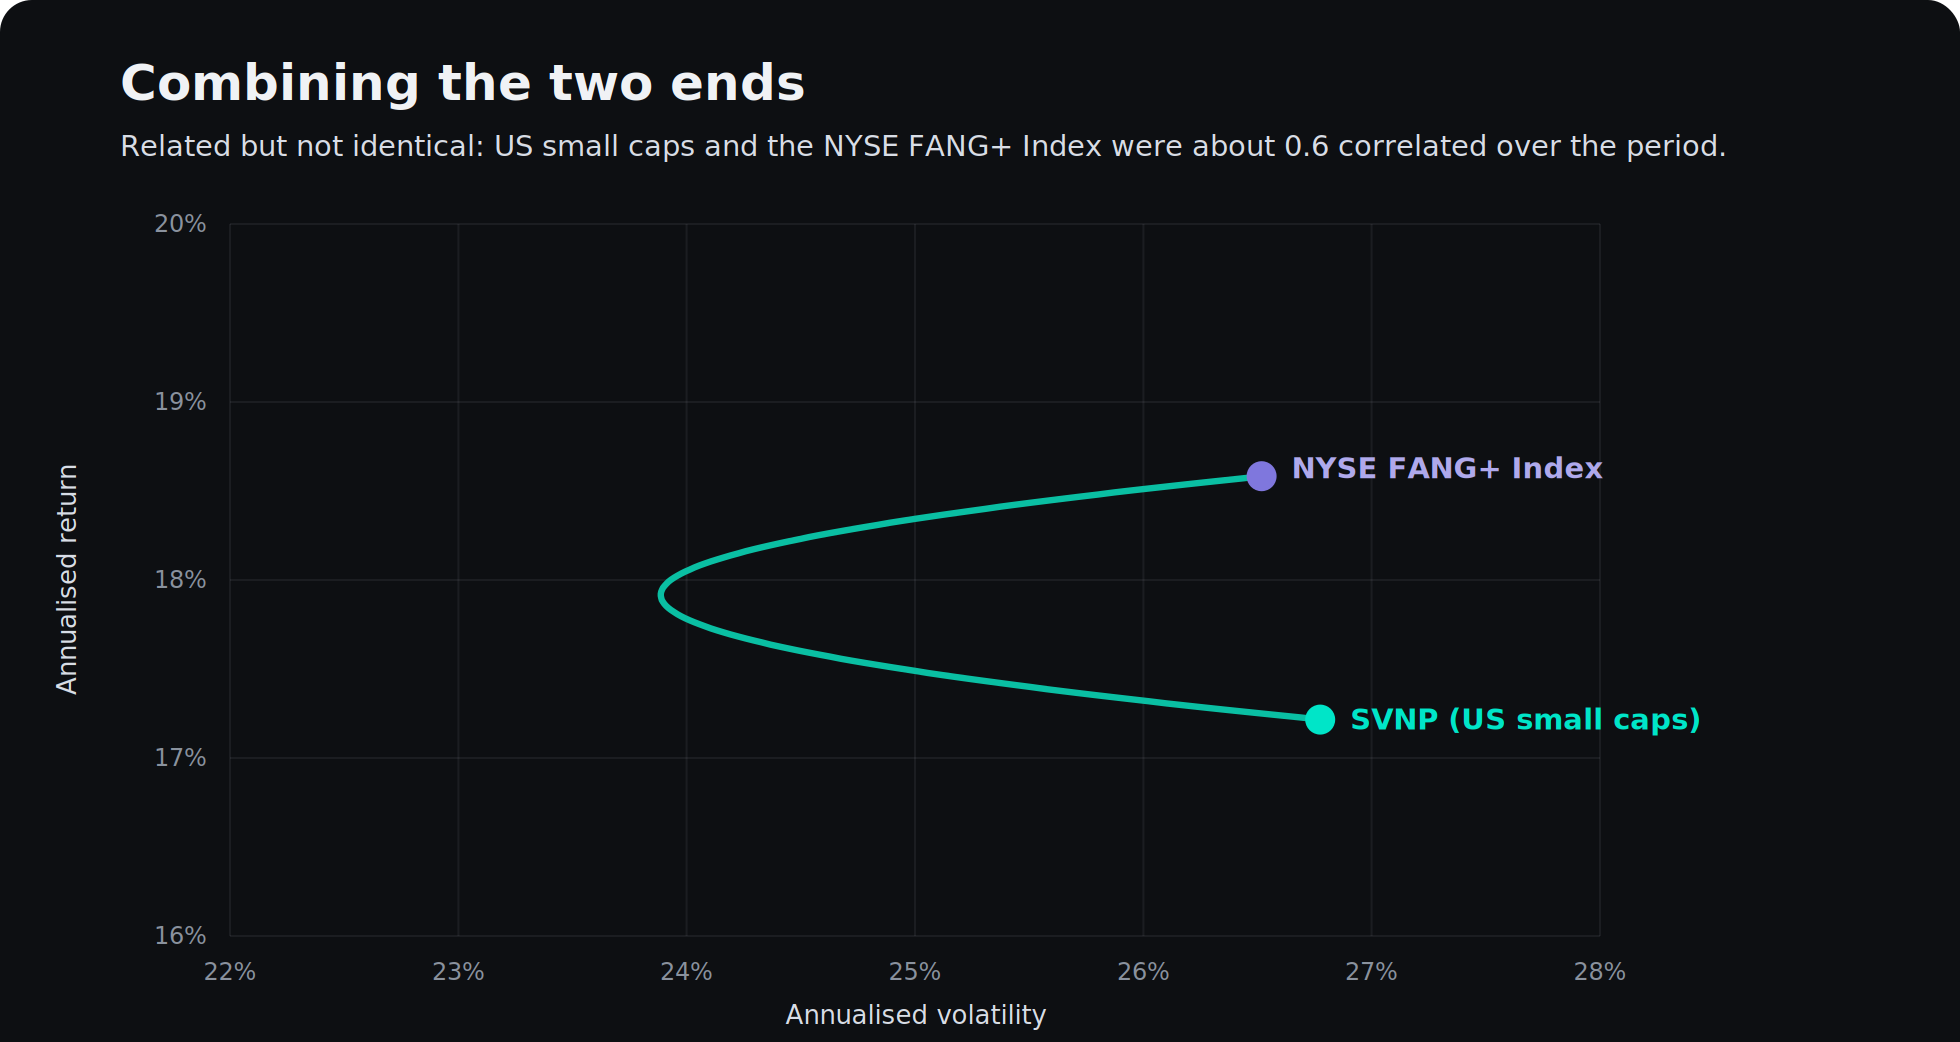
Source: Savana, S&P Global, Global X. Annualised return and volatility in AUD, from SVNP’s inception on 6 November 2024 to 11 June 2026. SVNP’s annualised return over this period is approximately 17.2%, which covers a later period than the 14.95% since-inception figure shown in the performance table above (to 31 May 2026) and is therefore not directly comparable. US small caps and the NYSE FANG+ Index were about 0.6 correlated, so blends of the two (the curve) carried less risk than holding either alone. The blends shown by the curve are hypothetical, modelled combinations and do not represent actual investor returns. The NYSE FANG+ Index is represented by the Global X FANG+ ETF (ASX: FANG) as a proxy, with distributions reinvested; both series are total return. A short, period-specific history; past performance is not a reliable indicator of future performance.
The combined graph reflects the logic of our structure. It pairs index-like ownership with the part of the market where prices already reflect the available information, and active ownership with the part where they may not, instead of paying for selection across the whole market or accepting whatever concentration the index happens to deliver.
Savana’s US Small Caps Active ETF (ASX: SVNP) is built for the second end of that barbell. It applies a systematic, rules-based process to identify mispricing in companies that receive comparatively little coverage, the conditions under which the gap between price and value is widest. Since listing in November 2024, it has outperformed its S&P Small Cap 600 benchmark by approximately 12.05% per annum.
The case for the United States has not changed; what a barbell changes, in our view, is the discipline brought to owning it. Index ownership for the part of the market the crowd has already priced, active ownership for the part it has stopped watching. The edge, where there is one, tends to live where attention is thin, and at the moment that is the small end of the largest market in the world.
1 Francis Galton, ‘Vox Populi’ (1907), reproduced at galton.org:http://www.galton.org/essays/1900-1911/galton-1907-vox-populi.pdf.
2 Scott E. Page, The Difference: How the Power of Diversity Creates Better Groups, Firms, Schools, and Societies (Princeton University Press, 2007).
3 Scott E. Page, The Difference: How the Power of Diversity Creates Better Groups, Firms, Schools, and Societies (Princeton University Press, 2007).
4 ‘SpaceX blasts off with a record-breaking $75 billion IPO’, NPR, 11 June 2026, https://www.npr.org/2026/06/11/nx-s1-5853199/spacex-ipo-price-elon-musk.
5 S&P Dow Jones Indices, SPIVA U.S. Scorecard Year-End 2025. In 2025, 79 percent of active large-cap US funds underperformed the S&P 500; over the 20 years to December 2025, around 92 per cent did.
6 The NYSE FANG+ Index is an equal-weighted index of ten of the largest and most heavily traded US technology and internet companies, the original FANG names (Meta, Amazon, Netflix and Alphabet) alongside peers such as Apple, Microsoft and Nvidia, rebalanced quarterly and maintained by ICE Data Indices. Its tight, equally weighted membership makes it a concise gauge of mega-cap technology, which is why it stands in here for the large-cap technology end of the market.