September was a challenging month for US small caps. The S&P SmallCap 600 Index declined on 13 of 21 trading days, falling 5.6% in USD terms and 2.7% in AUD terms over the month. The weakness reflected a combination of sharply higher US bond yields and increasingly narrow market leadership, with performance concentrated in a small group of semiconductor and AI-infrastructure stocks.
Against this backdrop, SVNP returned -7.65%, underperforming the benchmark by 4.92 percentage points. The Fund’s relative weakness partly reflected its lack of exposure to the strongest-performing AI-related semiconductor names. Across the S&P 600, only 23% of companies delivered a positive return, compared with approximately 90% of semiconductor stocks. In aggregate, the semiconductor industry group rose more than 15% for the month.
Weakness within SVNP was also broad-based. Of the 42 stocks in the fund during September, only five finished higher. Several positions that were already trading on depressed valuations sold off further as risk appetite deteriorated, amplifying the portfolio’s decline.
More broadly, September reinforced themes discussed in recent letters. Small-cap returns are becoming increasingly sensitive to two forces: higher discount rates and the continuation of the AI trade. In August, we noted that long-term bond yields were already near multi-decade highs and that the next phase of small-cap performance would increasingly depend on earnings delivery rather than further re-rating. September strengthened that view. With the US 10-Year Treasury yield rising to 5.29% and valuations across parts of the AI complex continuing to expand rapidly, the hurdle for future equity returns has increased.
Despite the recent divergence, we remain convinced that the long-term opportunity in US small caps will ultimately depend on disciplined stock selection rather than narrow thematic exposure. SVNP’s objective remains unchanged: to identify companies where market prices have moved materially away from fundamentals, allocate capital while that mispricing persists, and redeploy it once the opportunity has closed. That same discipline has underpinned the Fund’s longer-term track record, even through periods of short-term benchmark divergence.
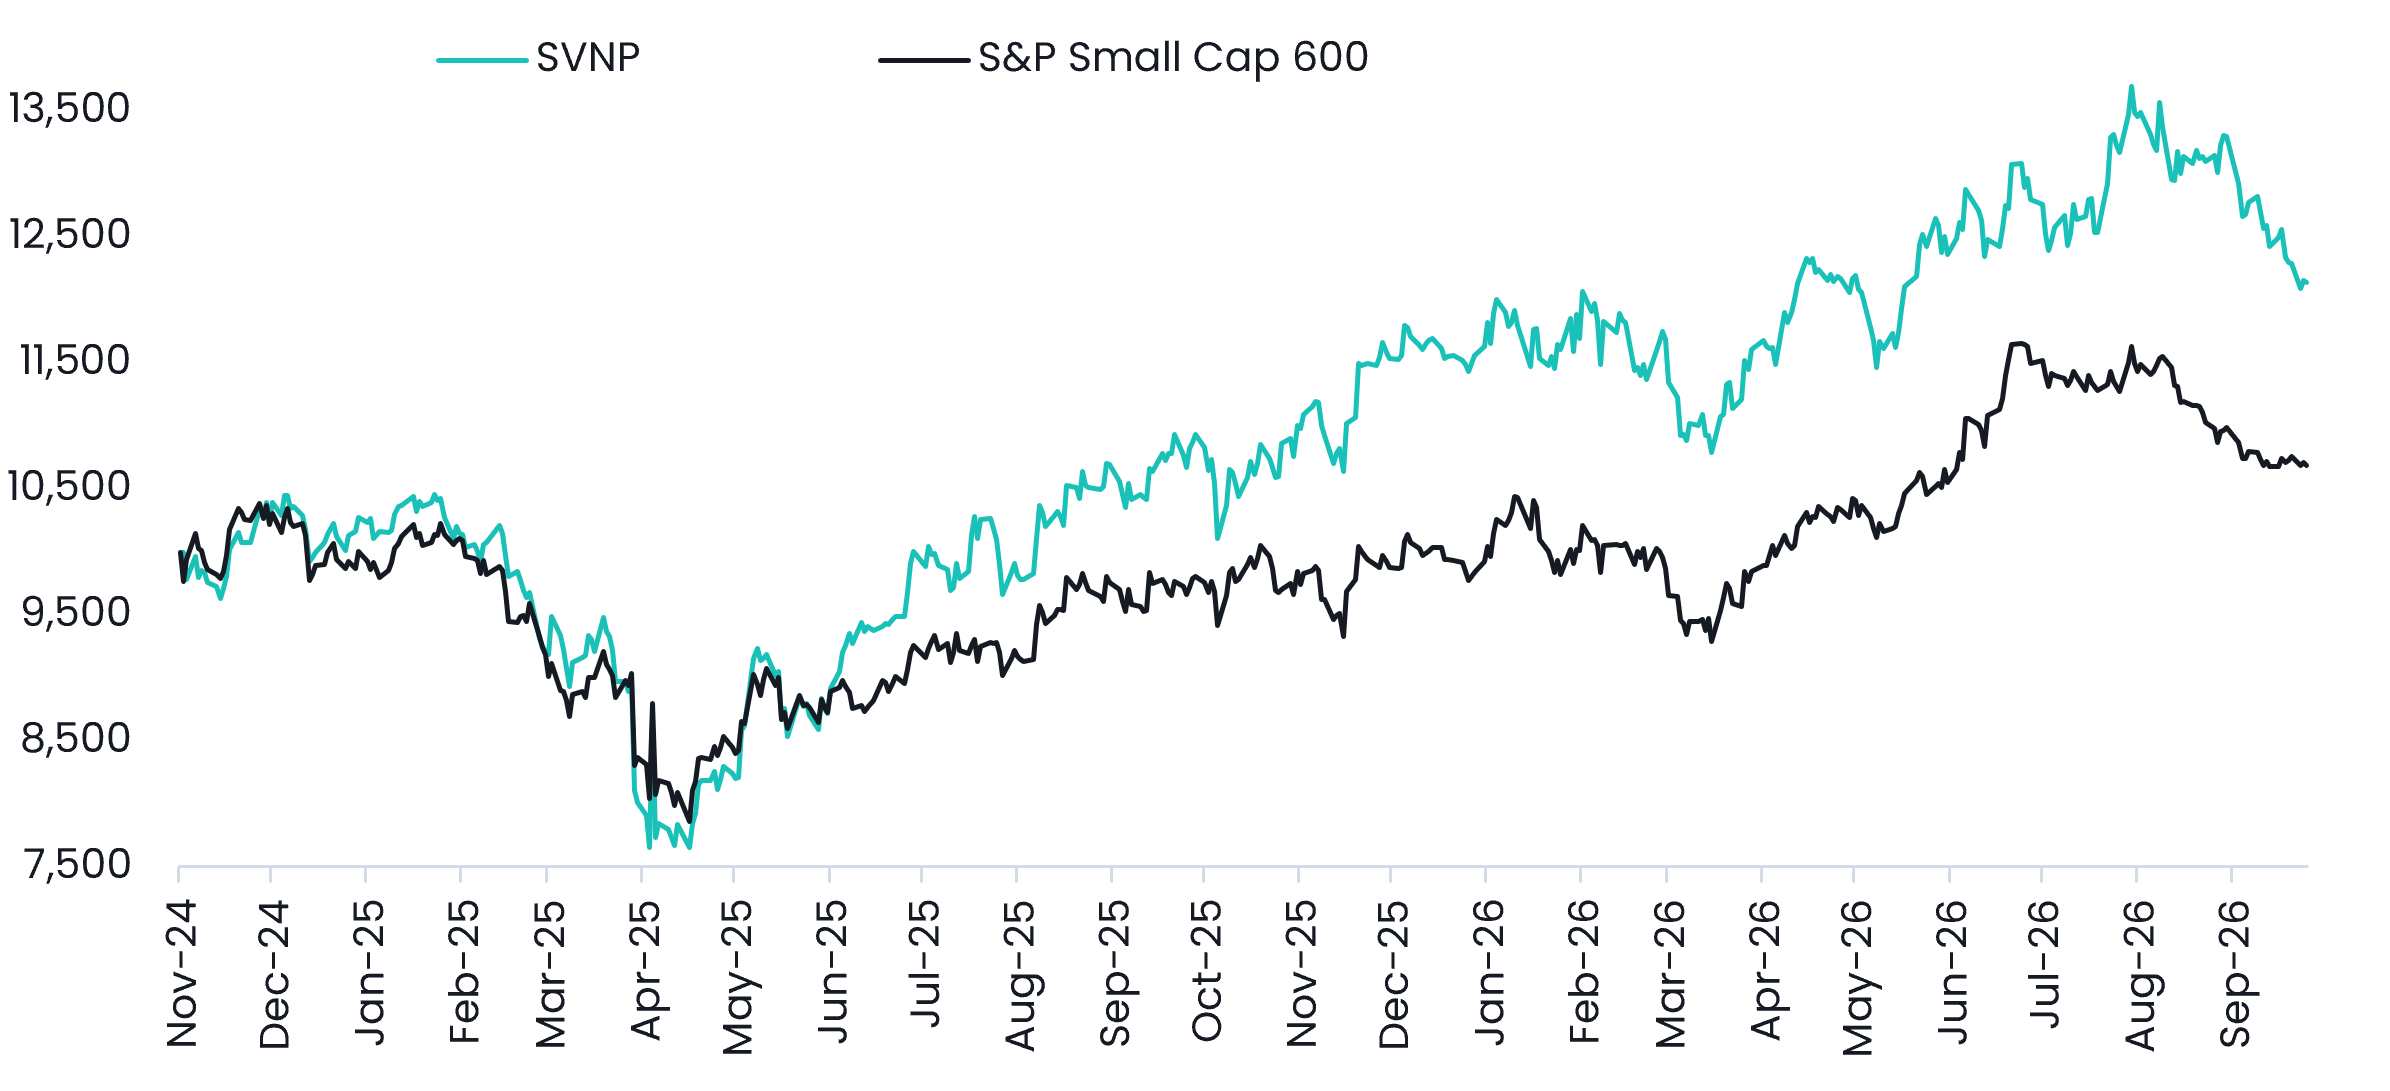
Source: S&P Global, Savana. Value of a hypothetical A$10,000 investment in SVNP since inception on 6 November 2024, based on close-of-day net asset value per unit, as of 30 September 2026. Returns are after fees and costs with dividends reinvested. Past performance is not indicative of future performance.
Source: S&P Global, Savana. As of 30 September 2026. The Savana US Small Caps strategy was implemented on the ASX as of the 6th of November 2024. Total returns are calculated in Australian dollars based on the close-of-day net asset value per unit as at the last day of the given period. Returns are after fees and costs with dividends reinvested. Returns for periods greater than one year are annualised. ‘Relative’ figures are the arithmetic difference between the SVNP and benchmark returns shown; the ‘Since Inception’ relative figure is therefore a per-annum differential. Past performance is not indicative of future performance.
Source: S&P Global, Savana as of 30 September 2026.
September’s sell-off was notable not simply for its magnitude, but for the unusual way in which returns were distributed across the market. Two forces dominated: a sharp increase in the cost of capital weighed on the broader small-cap universe, while a narrow group of AI-related semiconductor stocks continued to move sharply in the opposite direction.
The impact of higher rates was particularly pronounced. The US 10-Year Treasury yield rose a further 54bps during September to 5.29%, its highest level since 2007. More unusually, the trailing one-month correlation between daily S&P 600 returns and movements in the 10-Year Treasury yield fell to -0.64, compared with a 10-year average of +0.11. In other words, day-to-day movements in bond yields were exerting an unusually strong influence on small-cap equity returns.
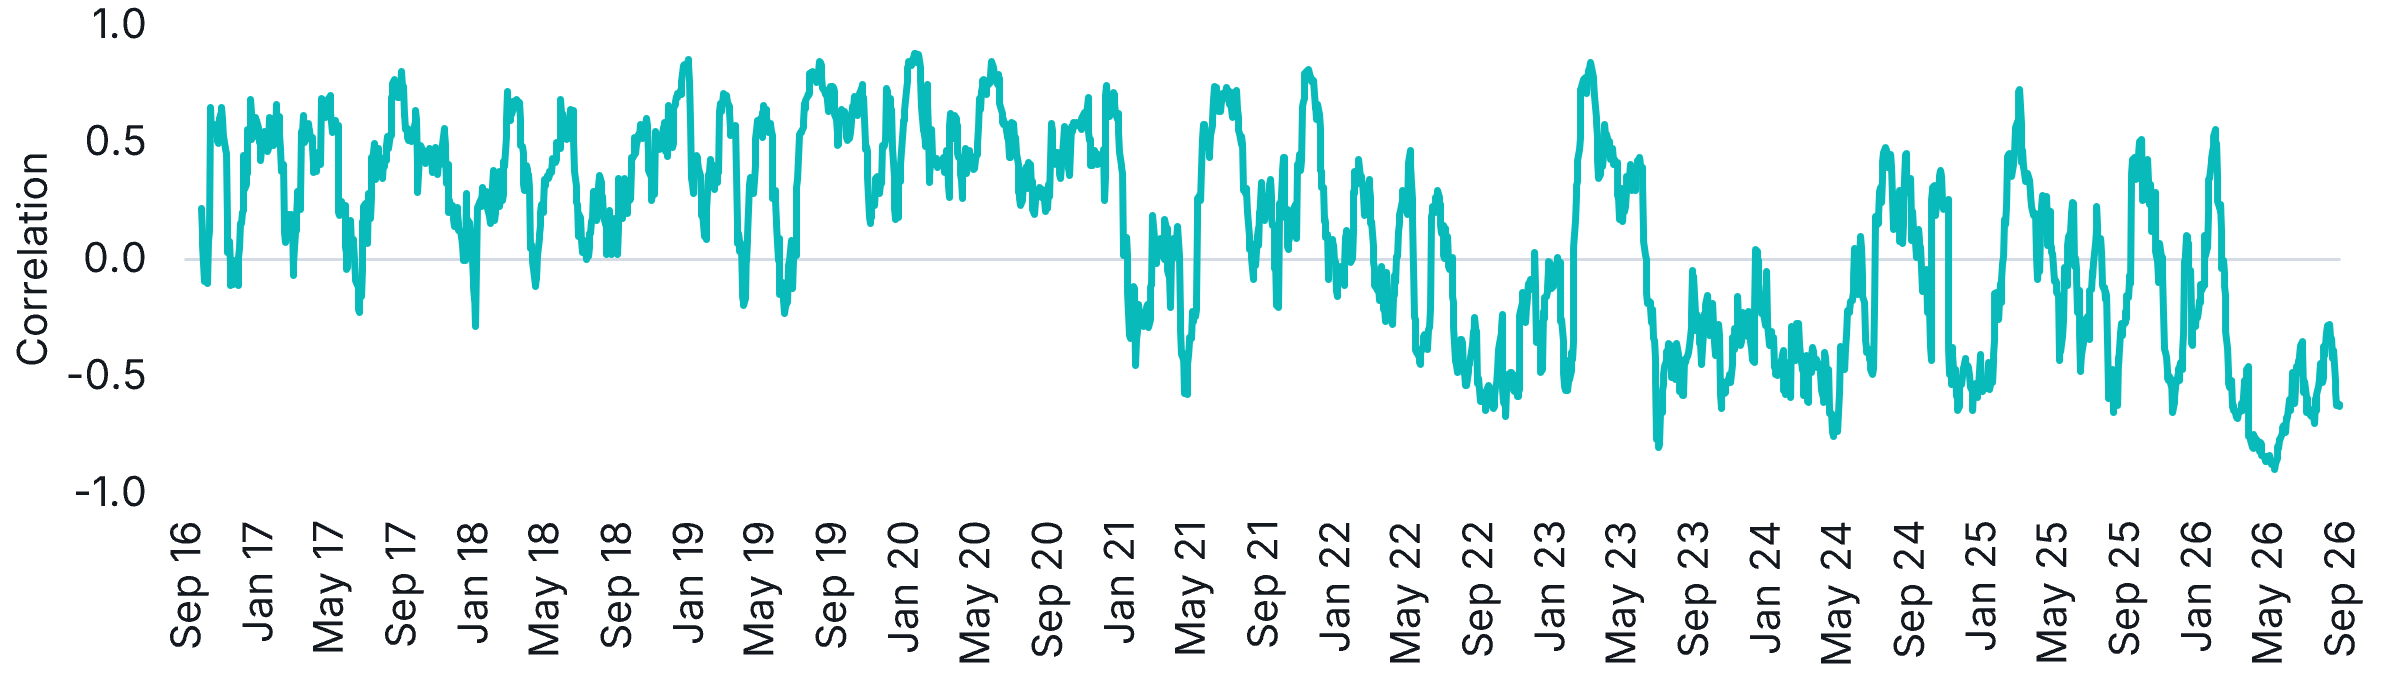
Source: S&P Global, Savana. Trailing one-month correlation between daily S&P SmallCap 600 Total Return (USD) Index returns and daily movements in the US 10-Year Treasury yield, September 2016 to 30 September 2026.
Yet this pressure was far from uniform. Approximately 90% of semiconductor stocks finished September higher, despite weakness across most of the broader index. The result was effectively a two-speed market: rising discount rates were compressing valuations across much of the small-cap universe, while enthusiasm surrounding AI infrastructure continued to support a relatively narrow group of securities.
That divergence has become increasingly relevant to SVNP’s relative performance. It is not the sole explanation for recent outcomes - September also saw broad weakness across the portfolio - but the Fund’s lack of exposure to the strongest AI-related semiconductor names has become an important factor at the margin. Over recent months, SVNP has generally performed better relative to the benchmark when the AI trade has weakened, and lagged when it has accelerated.
MaxLinear Inc. provides a clear illustration. This semiconductor company has emerged as one of the most prominent beneficiaries of the AI-infrastructure theme within the S&P 600, rising approximately 400% in the year to date. Over the four months from June to September, the correlation between MaxLinear's monthly return and SVNP's excess return relative to the S&P 600 has been -0.96 - an almost perfectly inverse relationship.
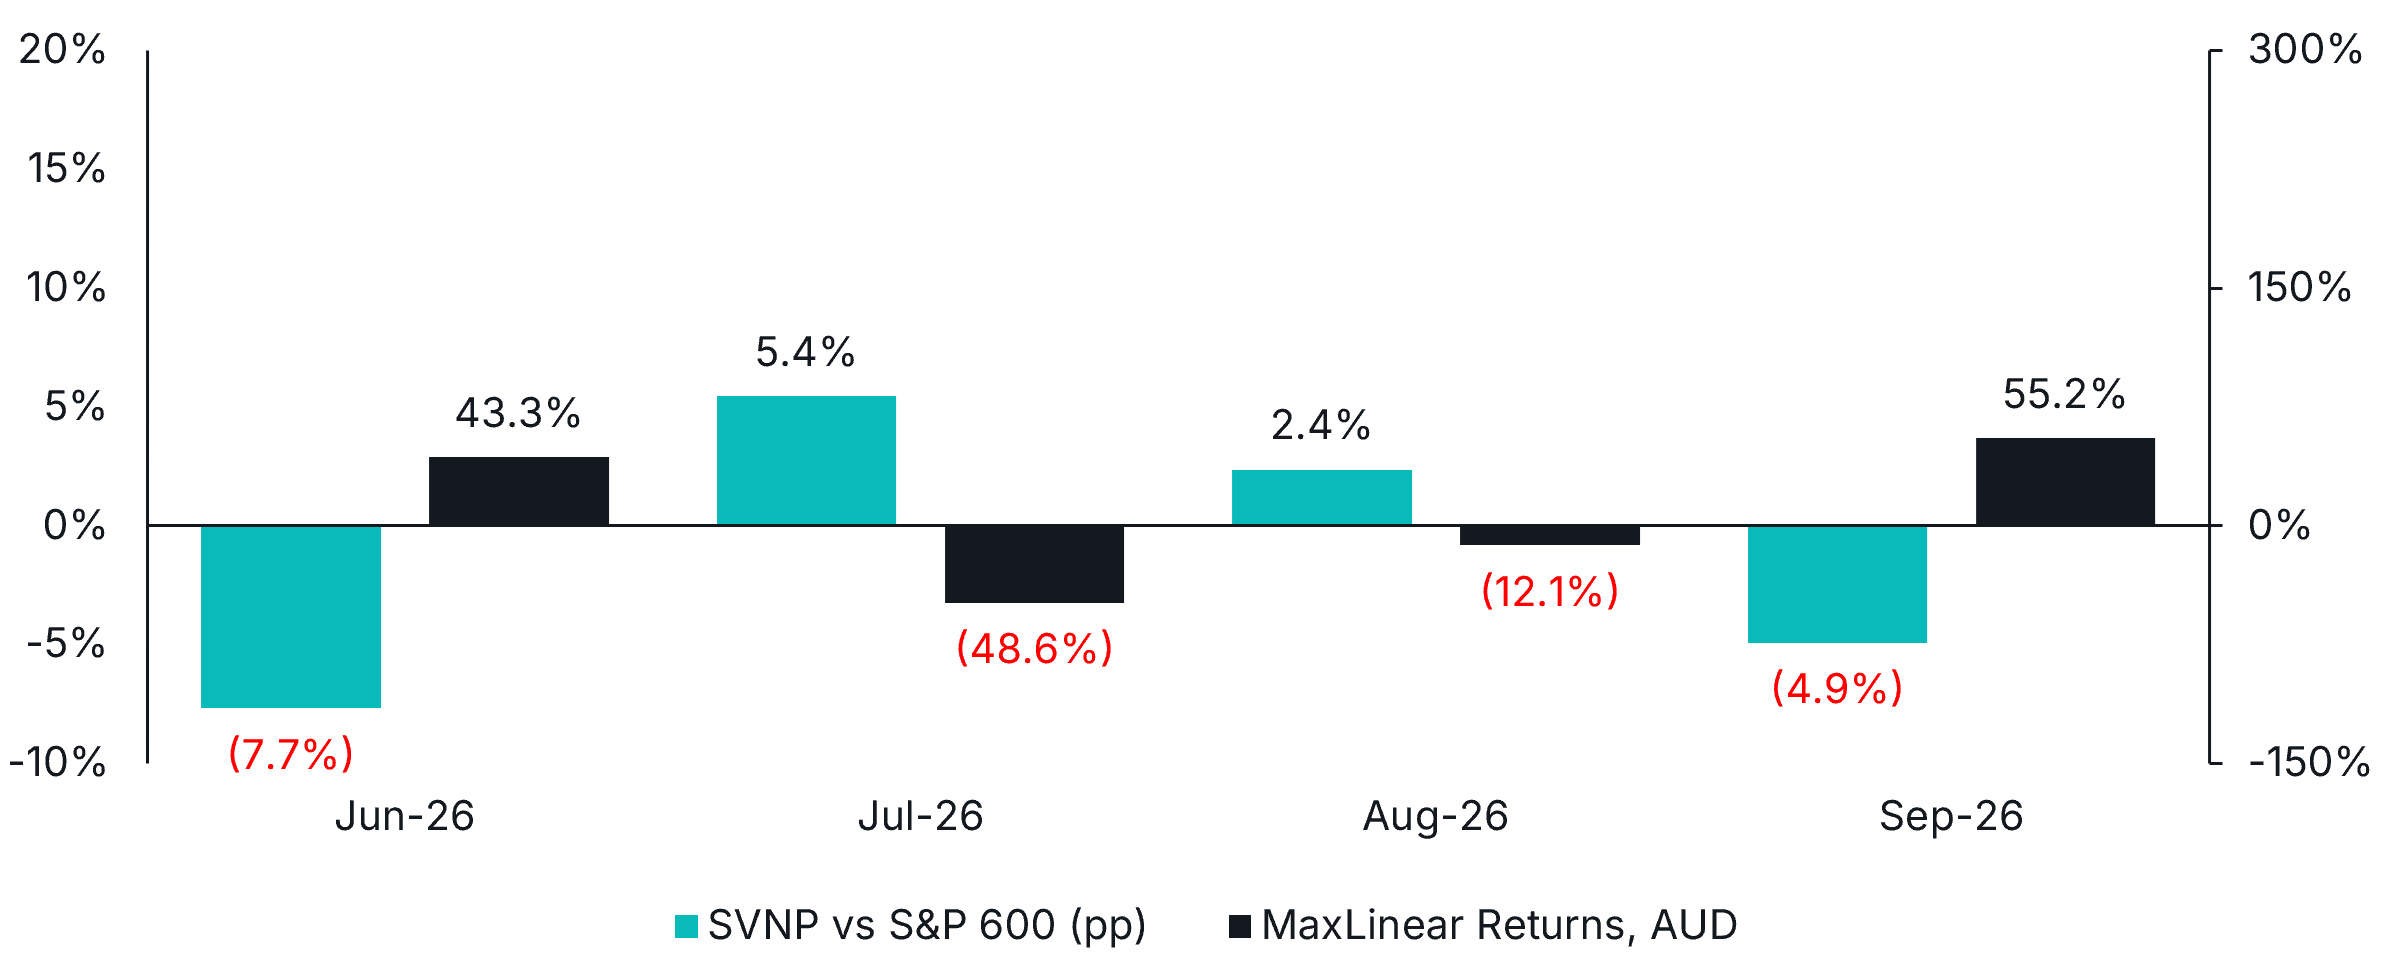
Source: S&P Global, Savana. MaxLinear Inc. monthly return (right axis) and SVNP excess return relative to the S&P SmallCap 600 (AUD) (left axis), June to September 2026. Past performance is not indicative of future performance.
The significance of this is not that MaxLinear alone determines benchmark outcomes, but that it is representative of a broader pattern. Despite comprising only a relatively small part of the index, AI-related semiconductor stocks have generated returns large enough - and volatile enough - to exert a disproportionate influence on short-term benchmark performance. MaxLinear rose approximately 43% in June, fell 49% in July, declined another 12% in August, and then rebounded 53% in September.
These swings can materially distort the relative picture. When a narrow group of high-momentum stocks rallies sharply, managers without exposure can lag even if the broader market is weak. Conversely, when those same names reverse, relative performance can change just as quickly.
So, where to from here? Our house view remains that the structural AI investment cycle is legitimate and that the theme should not simply be dismissed as a bubble. However, we also believe that, for a number of companies - particularly within small caps - share-price appreciation has moved substantially ahead of underlying fundamentals.
MaxLinear provides one such example. Since January, its share price has risen by approximately 400%, while revenue has increased by around 22% and gross profit by 23%. Over the same period, its price-to-sales multiple has expanded from approximately 2.1x to 14.3x, while last-twelve-month earnings per share remain negative.
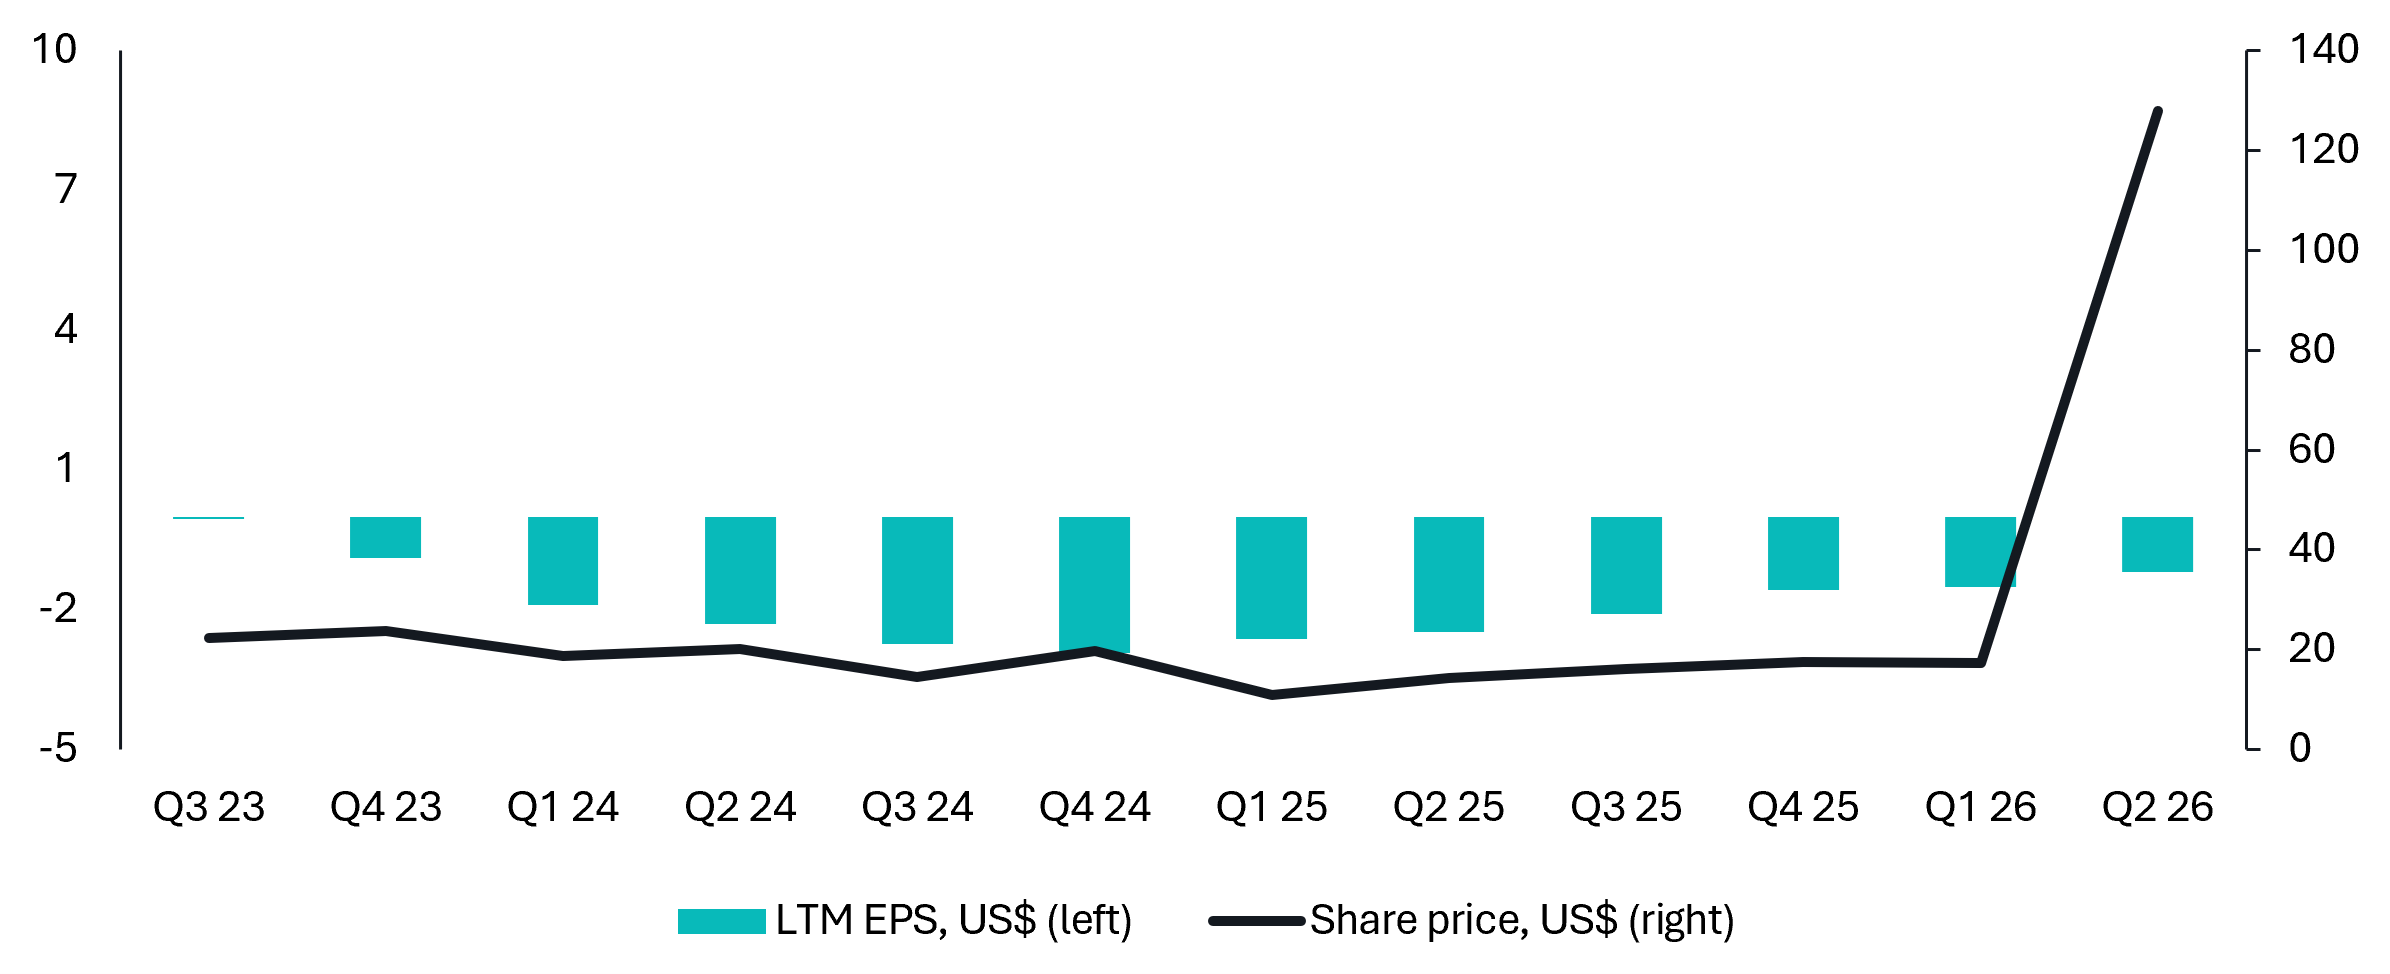
Source: S&P Global, Savana. MaxLinear Inc. last-twelve-month (LTM) earnings per share (left axis, US$) and share price (right axis, US$), Q3 2023 to Q2 2026.
This does not mean that MaxLinear, or the broader AI trade, cannot continue to perform. It does, however, mean that increasingly optimistic expectations are now embedded in valuations. From these levels, continued outperformance requires fundamentals to catch up with those expectations, while any disappointment in growth, margins or the broader AI investment cycle creates considerably greater downside sensitivity.
This distinction is important for understanding SVNP's recent performance. The portfolio's sporadic weakness in recent months has coincided with a period in which benchmark returns have been unusually influenced by a narrow, momentum-driven segment of the market that our valuation discipline has largely kept us out of. Savana's process is deliberately designed not to chase securities simply because prices are rising. It seeks opportunities where underlying fundamentals suggest the market is mispricing value.
There will therefore be periods when the portfolio does not participate in powerful thematic rallies. We regard this discipline as fundamental to the strategy. Our objective is not to replicate the themes currently driving the benchmark, but to generate sustainable long-term returns through repeatable, fundamentally driven stock selection.
As the AI trade matures and the hurdle for further multiple expansion rises, we expect fundamentals to play an increasingly important role in differentiating winners from losers. If that occurs, the unusually large influence of a small number of AI-related securities on S&P 600 performance should diminish, allowing broader stock selection to reassert itself as a more important driver of relative returns.
If MaxLinear is a case study in the power of thematic momentum, Everforth Inc. (NYSE: EFOR) is a case study in its opposite: a company where deteriorating sentiment overwhelmed the fundamentals and created the kind of valuation dislocation Savana is built to exploit.
EFOR is a technology and digital engineering company providing IT solutions to corporate and government clients. Its share price fell from approximately US$125 in late 2021 to US$17 by July 2026. Much of that decline was initially justified by weaker revenue and earnings. Over time, however, the share price began falling materially faster than the deterioration in the underlying business. Between January and June 2026, the share price fell 63% despite LTM revenue falling only 1% and LTM normalised EPS falling just 6%.
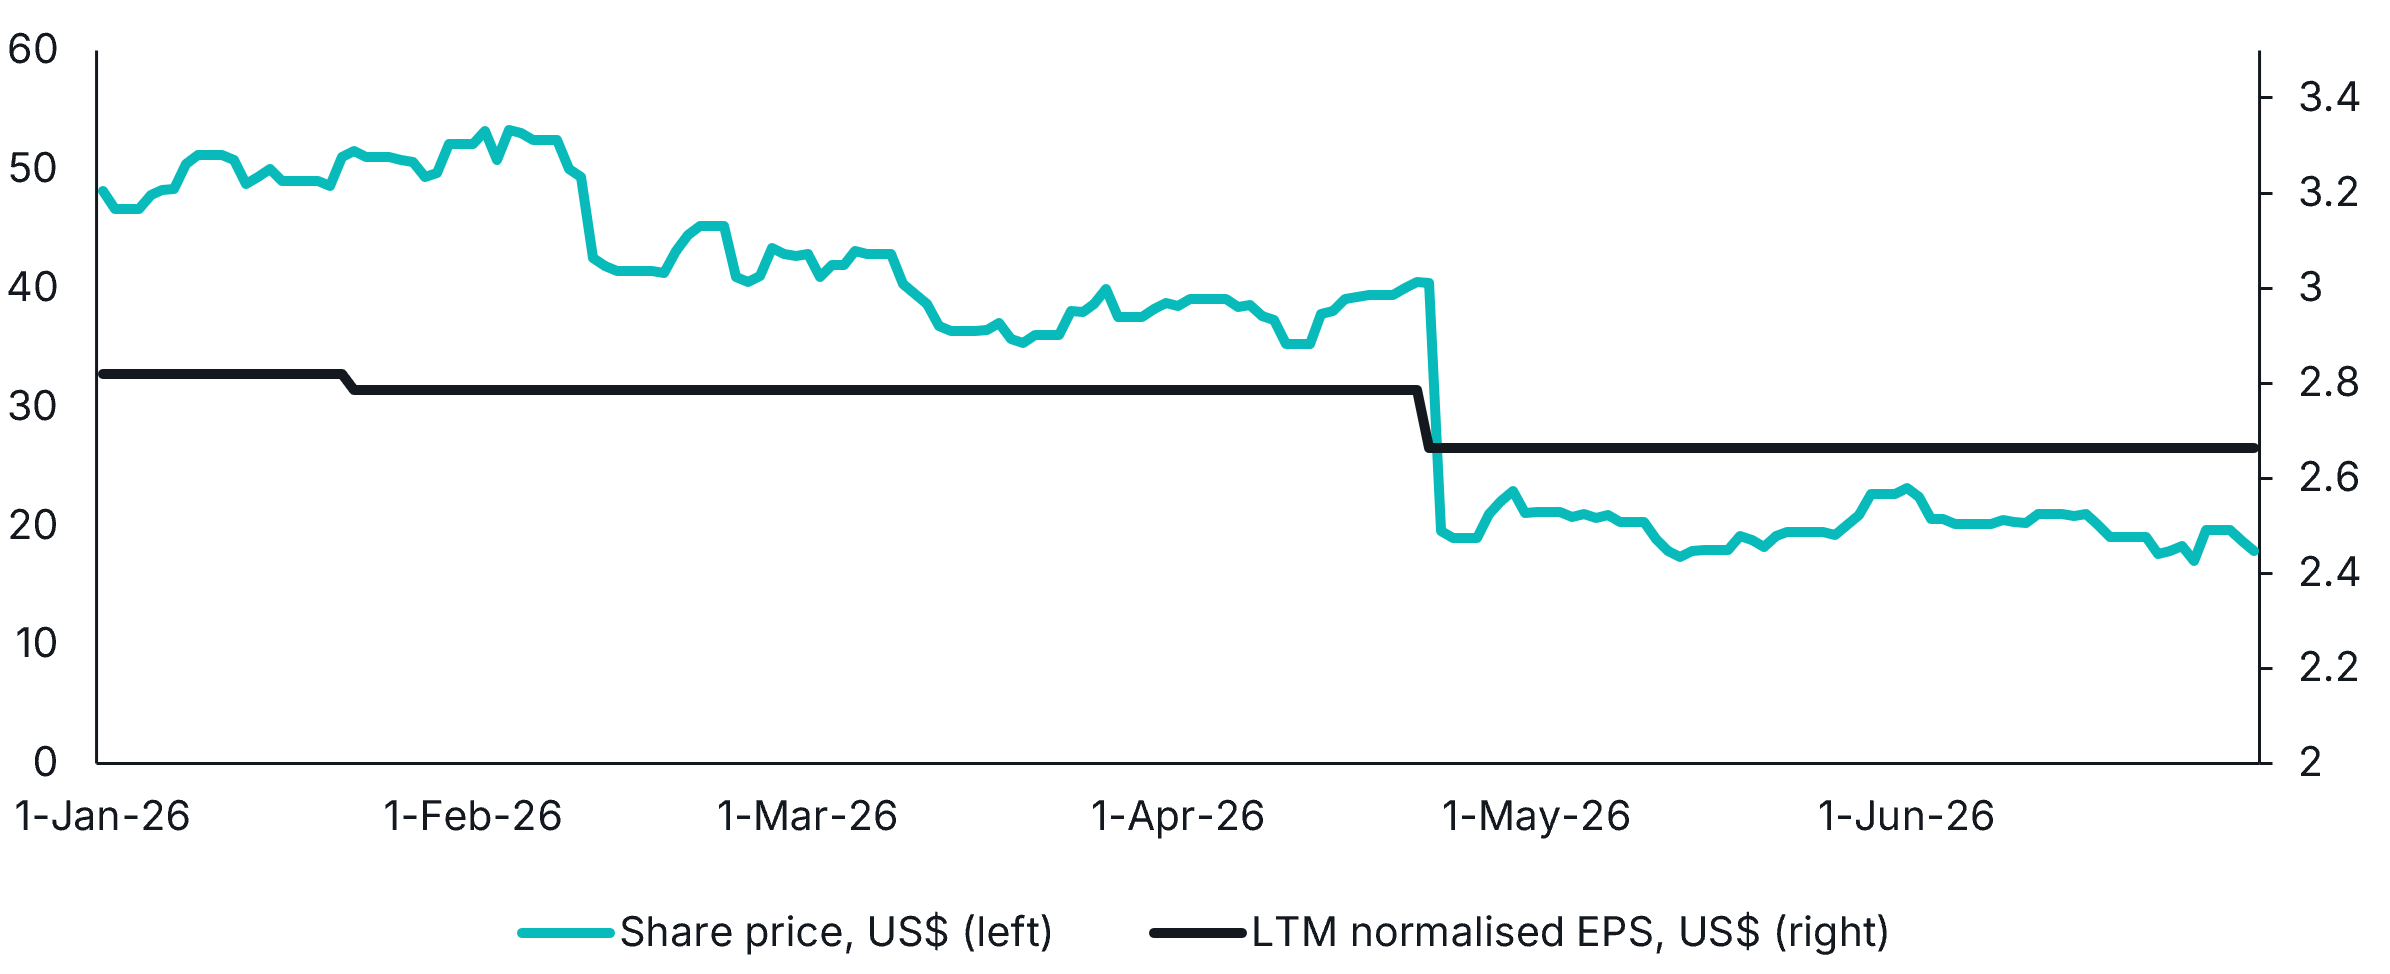
Source: S&P Global, Savana. Everforth, Inc. share price (left axis, US$) and last-twelve-month (LTM) normalised earnings per share (right axis, US$), 1 January to 30 June 2026.
This represented a classic fear-driven situation. As a share price falls, the discomfort associated with owning the company rises. At the same time, the falling price is perceived as a negative signal by the market, creating a feedback loop that reinforces the existing trend. Thus, selling begets more selling, creating a downward spiral that results in a stock becoming ‘oversold’.
This dynamic is well-supported by empirical research. Stock returns are consistently shown to be more volatile than what a normal distribution of probabilities would predict. As Eugene Fama wrote in 1965:
“If the population of price changes is strictly normal, on average for any stock…an observation more than five standard deviations from the mean should be observed about once every 7,000 years. In fact, such observations seem to occur about once every three to four years.”
Following the release of Q1 earnings on the 22nd of April, Everforth’s share price fell 52% in a single day. Revenue of US$968.3m was broadly in line with company guidance, but adjusted EPS of US$0.69 fell short of market expectations of approximately US$0.97. Herein lies another dangerous behavioural bias: investors tend to extrapolate recent experience into the future, placing disproportionate weight on the most recent events whilst discounting the possibility that conditions may stabilise.
This is where Savana’s algorithms stepped in. On 8 May, SVNP entered Everforth at approximately US$20.32 per share. At that point, the stock was trading at roughly 5.8x earnings or a 17% earnings yield.
On 28 July, Everforth announced a US$115m, three-year contract with the US Army to support AI research. The following day, the company reported second-quarter results showing adjusted EPS had recovered to US$0.91, up from US$0.69 in Q1, while adjusted EBITDA margin improved to 9.6% from 8.6%.
These positive events catalysed a sharp recovery in the share price. By 8 September, Everforth had risen to approximately US$30.92, at which point SVNP exited the position. From entry to exit, the stock appreciated by roughly 52% in four months.
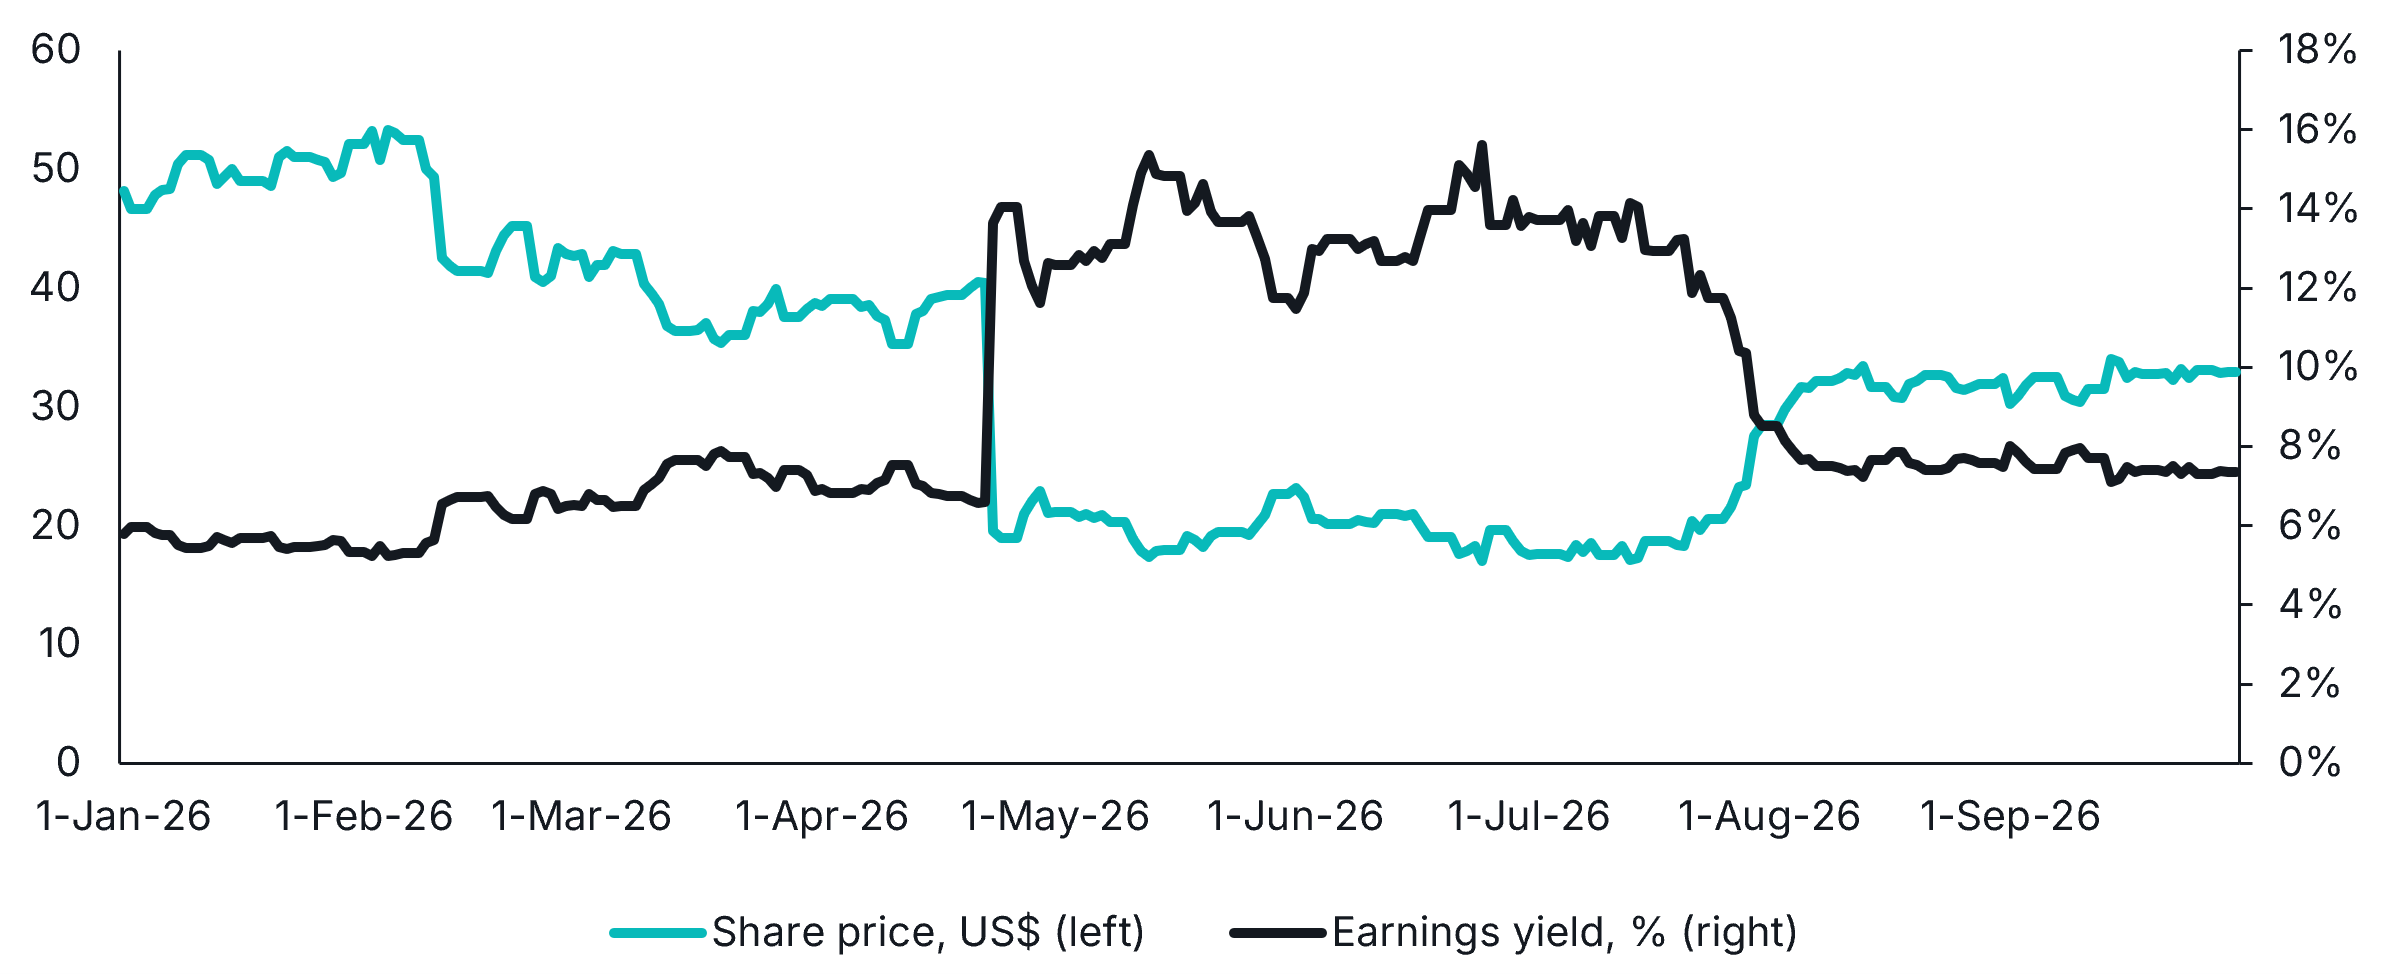
Source: S&P Global, Savana. Everforth, Inc. share price (left axis, US$) and earnings yield (right axis, %), 1 January to 30 September 2026.
So, did our algorithms know that the US Army contract would be announced, or that Q2 earnings would surprise to the upside? No. Without inside information, we believe it is practically impossible to consistently predict specific market events.
Instead, our process is designed to identify asymmetry. In oversold companies trading materially below our assessment of intrinsic value, much of the bad news may already be reflected in the price, while the potential benefit of stabilisation or positive surprise is not. In simple terms, even if the probability of the next development being positive or negative were evenly balanced, the expected return can still be attractive if the upside from being right is meaningfully greater than the downside from being wrong.
That is the edge we are trying to capture. We do not need every investment to work. A case like Everforth will not be repeated perfectly every time, and some positions will continue to deteriorate after we buy them. But if we can consistently identify situations where the payoff is skewed in our favour, then small statistical advantages, compounded across many independent decisions and over long periods of time, can become economically meaningful.
That is the essence of the Savana process: not predicting the future, but repeatedly positioning where the balance of probabilities and payoffs appears favourable.